Quarterly investors letter – Q3 2024
Market review
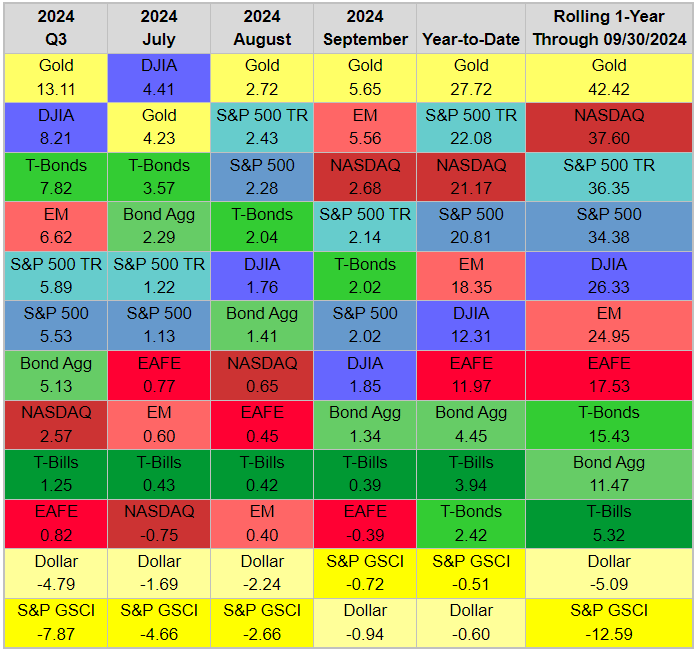
The unusual leadership ranking of asset classes, whether due to the election year or a pivotal moment in Federal Reserve monetary policy, remains perplexing. The Fed’s decision to cut rates by 50 basis points, despite solid economic data, disrupted normal correlations between benchmarks. Gold emerged as the top performer, while Commodities (S&P GSCI) suffered the most. In equities, the DJIA, despite being price-weighted, generally mirrors the S&P 500’s performance. However, the S&P 500 has outpaced the DJIA by 8.5% year-to-date, largely due to non-DJIA members like Nvidia. This marks the third-largest gap between the indices since 1926, following 1929 and 2023. Even more striking, the Utilities sector surged by 18.5% in Q3, compared to 5.5% for the S&P 500. Typically seen as defensive, Utilities tend to outperform during market downturns. Q3 was only the third time since 1972 that Utilities outperformed the S&P 500 by at least 10 percentage points while the S&P 500 was rising. Previous instances occurred after major declines, such as the Asian financial crisis in 1997 and the 2015-16 bear market. Utilities benefited from both falling interest rates and their perceived role as key infrastructure for AI. Following quarters have shown mixed results for the sector.
Gold firmly led the market, while most other assets followed suit, except for Commodities and the USD, making this year a bonanza so far. Gold surged 13.1% to a record high in Q3, bringing its year-to-date return to 27.7%. This marks its second-best start to the year since at least 1980, following 1986. In contrast, the S&P GSCI was the worst performing benchmark, falling 7.9% in Q3. Typically, gold and commodity benchmarks are positively correlated, but oil’s sharp 15.2% drop dragged commodity indices lower. Meanwhile, the U.S. dollar, often negatively correlated with gold, declined in Q3 after rallying alongside it in the first half of the year as the U.S. joined other central banks in cutting rates. The S&P 500 gained 20.8% year-to-date, ranking as the 16th-best first nine months since 1926 and eighth-best since 1950. The Nasdaq Composite, which led in the first half, posted a modest 2.6% gain in Q3 as market leadership shifted away from the “Magnificent 7.” Emerging markets outperformed in Q3, with the MSCI Emerging Markets Index gaining 6.6%, while developed markets, represented by the MSCI EAFE Index, only rose 0.8%.
Fixed income positively correlated with equities last quarter, with the Float Adjusted U.S. Aggregate Index rising 5.1%. Bonds rallied as confidence grew that the Fed would achieve its 2% inflation target, balancing inflation and employment risks, and beginning an easing cycle later in the quarter. Unsurprisingly, longer-duration assets performed best. Long-term Treasuries gained 7.8%, while investment-grade corporates rose 5.8%. The rally was broad, with credit leading the way. Emerging markets also performed well, boosted by a weaker USD.
Our take
In our last quarterly investment letter, we emphasized the importance of investing in antifragile assets to preserve and grow wealth, advocating against a return to the traditional 60/40 balanced approach. However, looking at the table above, one might think we dismissed this strategy too soon! While government bonds from developed markets may be performing well again (as they did during the deflationary trend of past decades), this quarter’s results cannot be viewed as evidence of renewed decorrelation. Treasuries have moved in tandem with riskier assets. As a result, we stand by and reaffirm our previous recommendation: invest in antifragile assets as part of your core asset allocation.
What is perhaps more important, our recommendation would not have underperformed compared to a balanced portfolio in the period—quite the opposite, we would have outperformed even in this particularly strong quarter for all asset classes. We will delve deeper into this in the next section on fund performance.
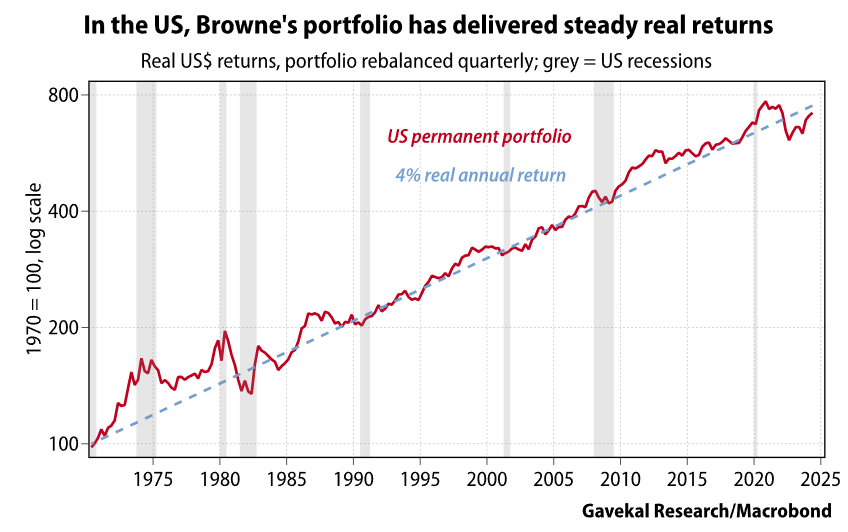
For now, we would like to revisit the concept of the Permanent Portfolio as outlined by Harry Browne. First introduced in his 1980s book Fail-Safe Investing and earlier newsletters, Browne’s strategy offers a balanced solution that can complement antifragile strategies. The Permanent Portfolio, which our friends at GaveKal have studied extensively, involves splitting assets equally across four categories: cash, 10-year government bonds, gold, and domestic equities. Aside from periodic rebalancing (monthly, quarterly, or annually), investors are advised to stop worrying about market fluctuations and focus on their lives. Across different countries, these portfolios have delivered 3% to 4% real returns annually, with low volatility and minimal double-digit declines.
While Browne recommended sticking to equal allocations, financial professionals often cannot resist adjusting portfolios for higher returns. We are confident that many of you can think of ways to enhance returns in the bond and equity portions, even in the cash part perhaps by adding undervalued currencies like JPY. At NCM, we can guide you on diversifying your gold allocation, especially as the price of gold reaches uncharted territory. Following gold’s strong performance compared to other precious metals, now is an opportune time to include or increase allocations to platinum, palladium, and silver in your portfolio. It is no coincidence that the precious metals allocation in our NCM Enhanced Physical Gold Macro Fund mirrors this approach closely.
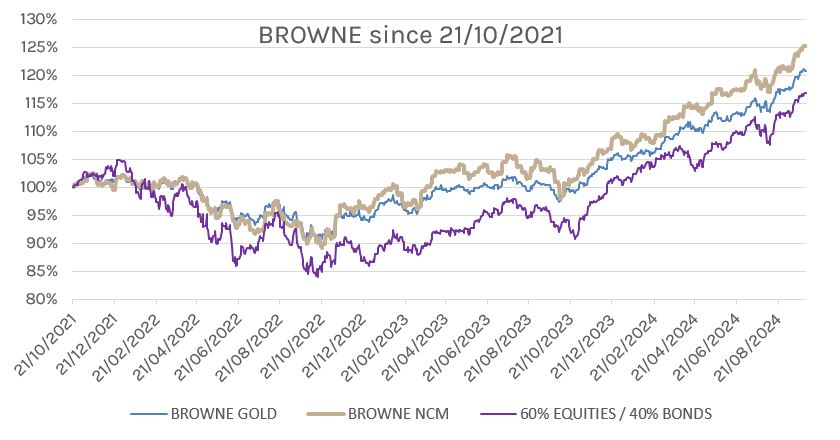
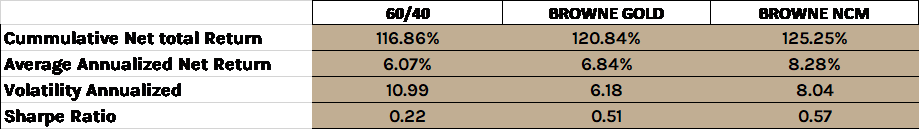
Since its launch three years ago, a Browne-style portfolio with a 25% allocation to the NCM fund instead of gold would have outperformed the traditional Browne portfolio by 144 basis points per year, and the balanced portfolio by 221 basis points, with the better Sharpe ratio confirming this outperformance on a risk-adjusted basis.
Since 21/10/2021:
NCM Enhanced Physical Gold Macro Fund Review
The fund has once again recorded a very strong quarter, the year-to-date (YTD) performance stands at +27% for both the USD share class and the CHF share class.
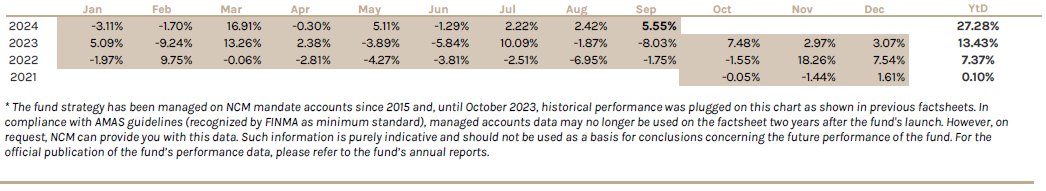
The impressive move on gold price over the quarter makes looking other assets contribution pale; nevertheless, it is worth highlighting that secondary precious metals, Silver and Palladium mainly, have also participate to the strong quarter performance as well as Latam currency carry trades. On the detractor side, our Gold hedging options have lost in value as did the short US 10Yr treasury position.
Looking Forward
With the price of gold navigating into unchartered territory, it is worth revisiting the metrics hinting at the yellow metal current valuation.
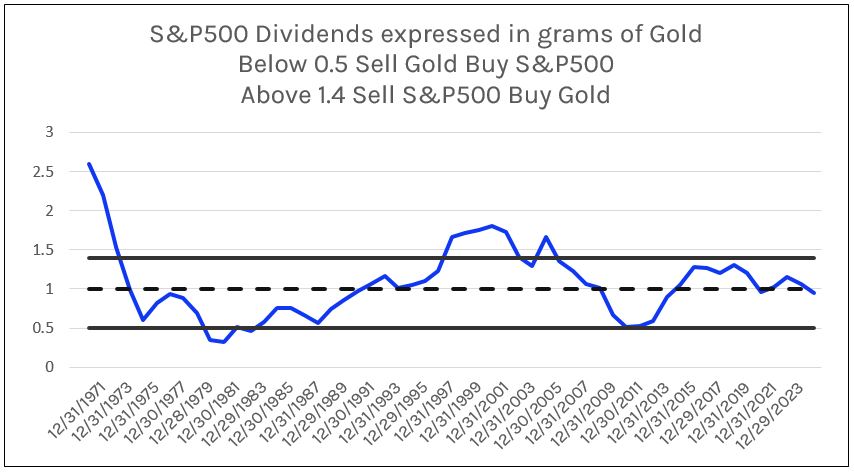
To start with, we look at the equivalence of S&P dividends expressed in Grams of Gold. The chart below tells us that we are in the middle of this ratio long-term range. It is reassuring that despite this year strong rally, this gold indicator does not flash red.
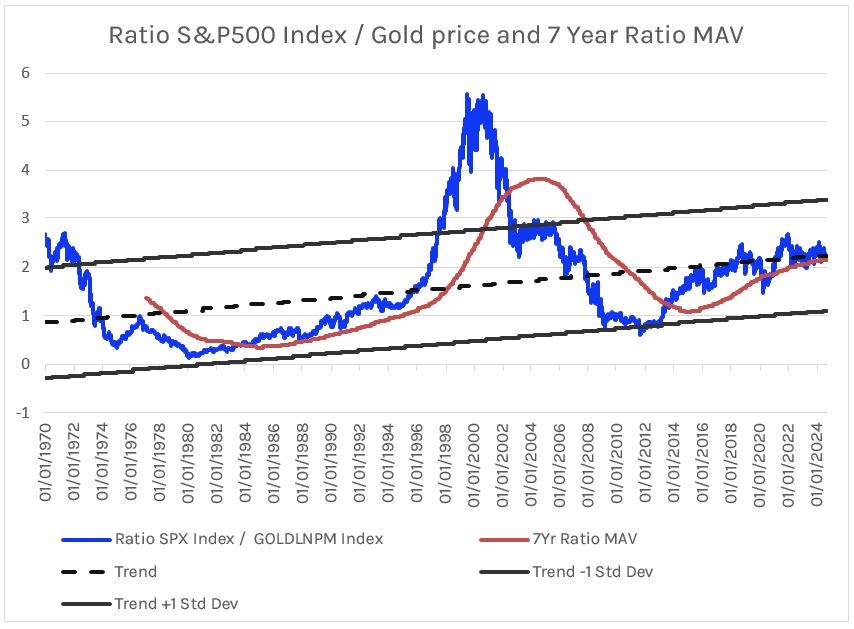
We also look at the interrelation between productive assets (S&P500) and scarcity assets (Gold) by charting the ratio S&P / Gold and adding its 7-year moving average (chart next page). It can be noted that not only the ratio stands in the middle of its long term trend, but it also sits right on the moving average. Given those are long term cycles, breaking down the average would signal a paradigm shift of the asset allocation between these two classes in favour of scarcity assets for a pronounced period of time.
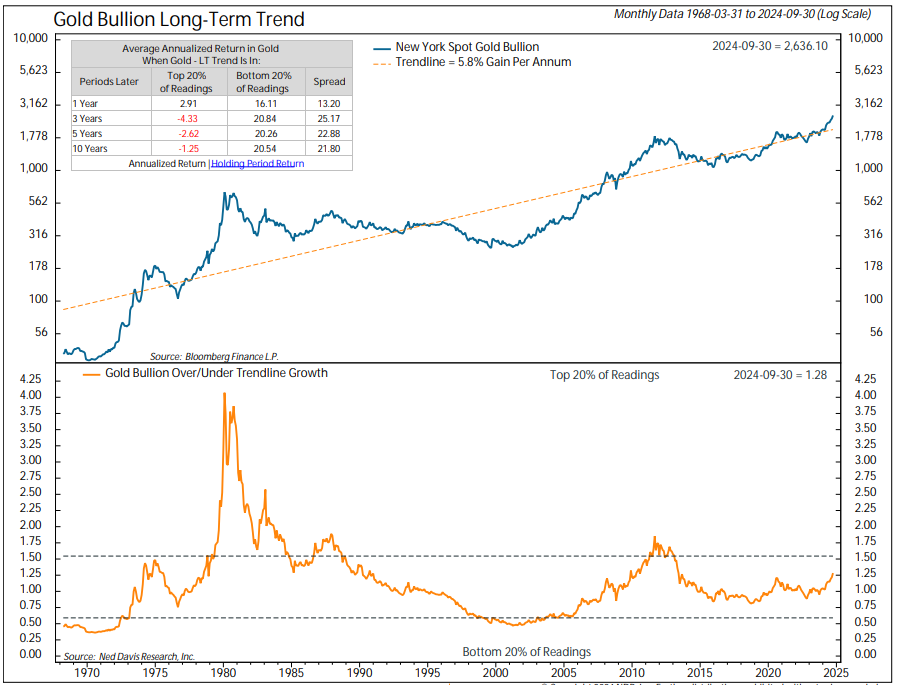
Gold deviation from its long term trend (chart below), ranked by top and bottom 20% readings sends an equivalent signal of absence of price excess, not to be confounded with a temporary overbought situation, which we will address in the next technical analysis chapter.
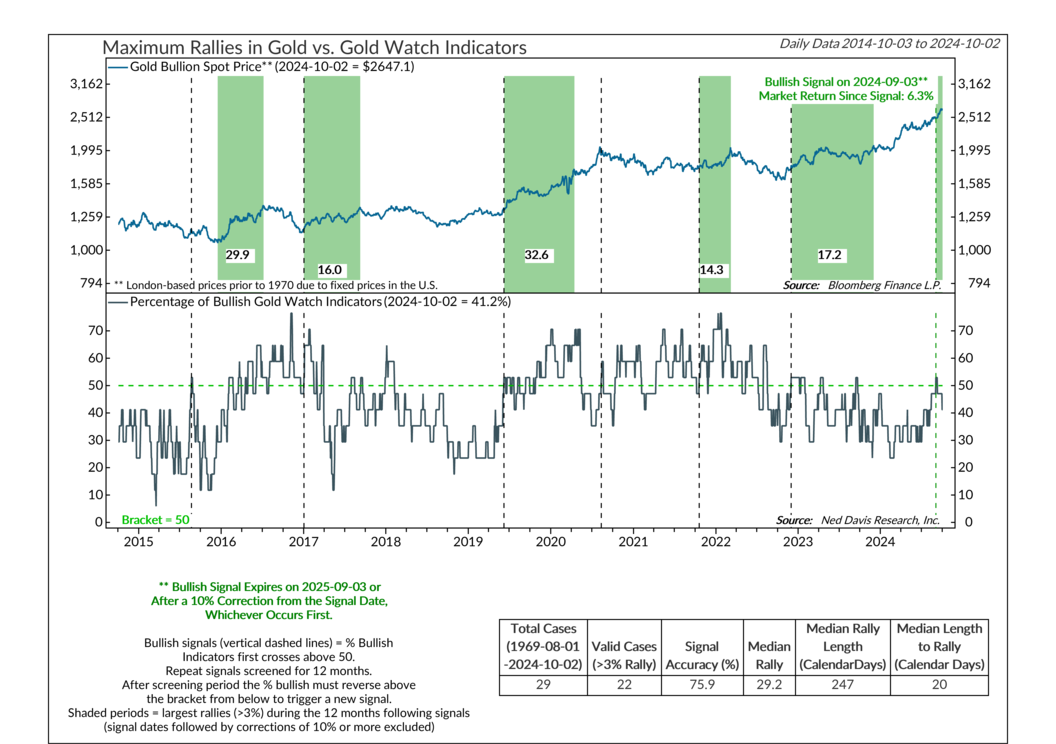
Another bright spot can be found in the recent buy signal generated by the Gold aggregated model on September 3rd.
Gold Technical Analysis Outlook:
- The Gold bullish breakout of the 2070 major resistance witnessed in early March 2024 was a crucial technical & cyclical bullish event. That well identified distribution area was the former top of 2020/2022/2023.
- This crucial bullish event confirmed that the current impulse wave 5 is underway and hence likely to make new cyclical highs in the next 12 to 24 months. This also drastically shifted positively market sentiment towards Gold, which is supportive to the primary bullish trend.
- Gold price action sharply rose in Q2 and Q3 2024, post the breakout witnessed in Q1-24 and a new historical high level formed in September 2024 at 2685 ref. This strong bullish move pushed price oscillators in deep overbought territory; hence, we expect a consolidation trading range for the next 2 months, helping oscillators to revert to neutral levels. We maintain our 2700 ref Gold target for year end 2024.
- Taking into account our cycle analysis of the current bullish long-term wave 5 and our technical expectation of further USD weakness, we expect more upside in Gold prices in the long term. We firmly believe the Gold long term bull cycle is NOT over and expect a bullish extension to 3000 up to 3200 ref in the next 12 to 24 months.
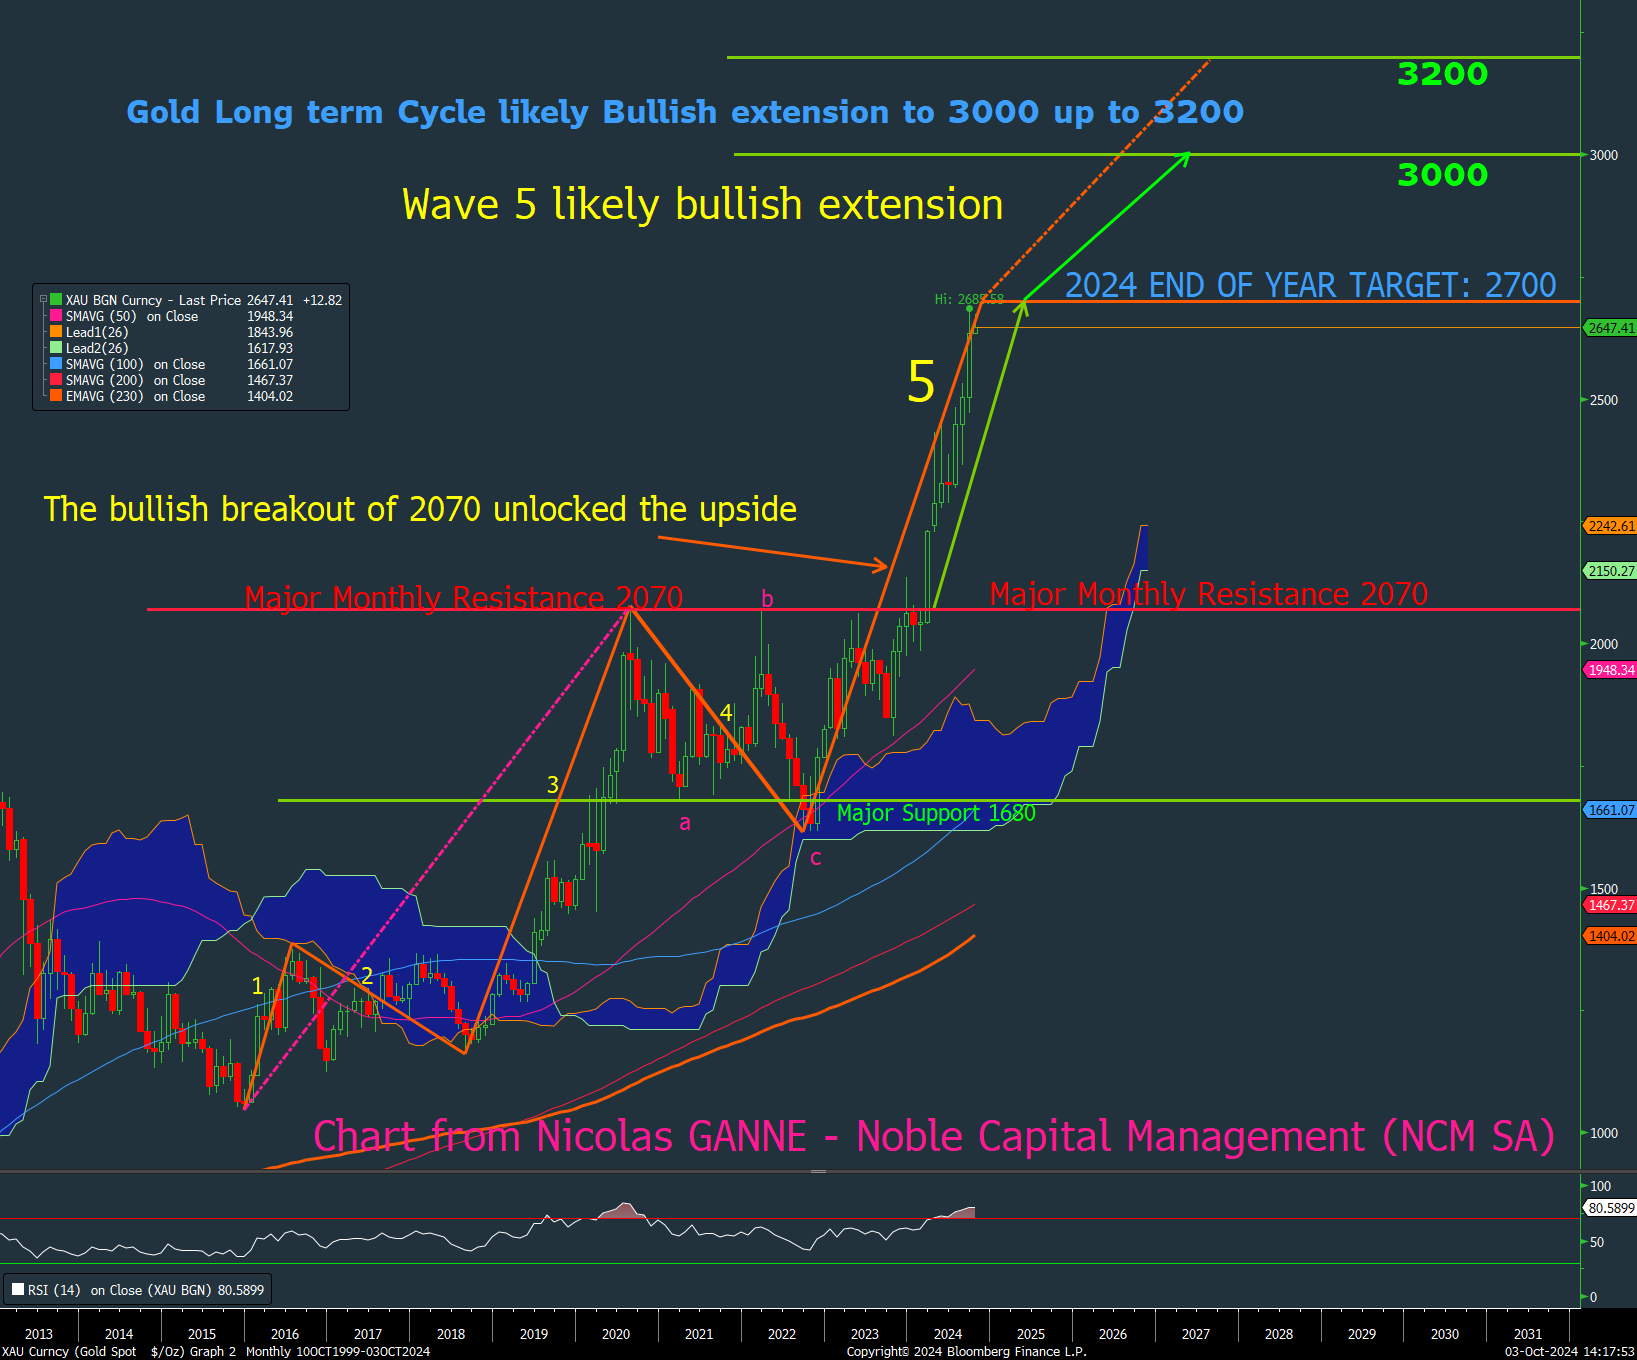
XAUUSD Monthly chart – Gold’s minimum long-term cyclical upside target at $3,000
Regardless of gold’s absolute performance in the short term, we are fully confident in our ability to generate alpha and deliver excess returns for our investors over the long run.
We would like to thank our long-lasting research partners, GaveKal Research, Vincent Deluard, CFA StoneX and Ned Davis Research for their highly valuable contributions.
Sincerely yours,
Hans Ulriksen, CEO and Fund Manager Christopher Boudin de l’Arche, Fund Manager
Legal information
This document is intended for information and/or marketing purposes only. It is not intended for distribution to, or use by, any person or entity who is a citizen or resident of any locality, state, country or jurisdiction where such distribution, publication, availability or use would be contrary to law or regulation. This document is not an offering memorandum and should not be considered a solicitation to purchase or invest in Noble Capital Management (NCM SA.
Disclaimer
NCM Enhanced Physical Gold Macro is a sub-fund of “NCM Alternative Assets, fonds à risque particulier” which is a contractual umbrella fund under Swiss law in the “other funds for alternative investments” category with specific risks. The sub-fund uses investment techniques whose risks cannot be compared with those of funds with traditional investments; in particular, the sub-funds may have significant leverage. Investors must be prepared to bear potential capital losses, which may be substantial or total. However, the fund management company and the asset manager endeavour to minimize these risks. In addition to market and currency risks, investors should be aware of risks relating to management, the negotiability of units, the liquidity of investments, the impact of redemptions, unit prices, service providers, lack of transparency and legal matters. These risks are detailed on pages 24 et 25 of the contractual fund.
Past performance is not a guide to future performance. Do remember that the value of an investment and the income generated from them can fall as well as rise and is not guaranteed, therefore, you may not get back the amount originally invested and potentially risk total loss of capital.
For a comprehensive list of risks involved in investing in the NCM Enhanced Physical Gold Macro Fund, please refer to the Appendix of the Fund Contract. If you have any doubts about the suitability of an investment, please consult a financial adviser.
The information and opinions contained herein are provided for information and advertising purposes only. It does not constitute a financial service or an offer under the Swiss Federal Law on Financial Services (FinSA). In particular, this document is neither an advice on investment nor a recommendation or offer or invitation to make an offer with respect to the purchase or sale of the sub-fund and shall not be construed as such. Further, this document shall not be construed as legal, tax, regulatory, accounting or other advice.
The terms and conditions, the risk information and other details on the sub-fund are contained in the fund documentation, in particular the Fund Contract and its Appendix. The Fund Contract and the Appendix of the NCM Enhanced Physical Gold Macro Fund as well as the annual reports and any other product documentation may be obtained on request and free of charge from Noble Capital Management (NCM) SA or the fund management company.
This document has been prepared based on sources of information considered to be reliable and accurate. However, the information contained herein is subject to change without notice and this document may not contain all material information regarding the financial instruments concerned. No representation or warranty is made as to the fairness, accuracy, completeness or correctness of the information contained herein. Noble Capital Management (NCM) SA is under no obligation to update, revise or affirm this document following subsequent developments.
0 Comments