Quarterly investors letter – Q4 2025
Executive Summary
After a year of strong but volatile returns, 2025 marked a decisive shift in global market leadership, currency dynamics, and asset-allocation regimes. Broad-based equity gains outside the United States, a structural USD downcycle, exceptional precious-metals performance, and a powerful rebound in fixed income reshaped portfolios and challenged familiar narratives.
This review examines how these forces played out across asset classes, and how disciplined, adaptive portfolio management translated regime change into performance.
In 2025, all three NCM strategies delivered standout results – each in its own way – with clear evidence of disciplined process and active risk management. The NCM Global Equity Selection Fund captured the year’s shifting leadership and volatility with an allocation-driven approach, posting a strong +24.3% net return (USD) and outperforming key global equity benchmarks. The NCM Fixed Income Opportunities Fund complemented this with an unusually consistent profile, +11.5% versus +7.2% for the benchmark, powered by a rare alignment across opportunistic credit themes, curve steepeners, and Latin American carry. In precious metals, the NCM Enhanced Physical Gold Macro Fund delivered an exceptional +90% annual return, materially ahead of gold’s +64%, as the Core–Satellite framework translated structural tailwinds into decisive alpha. What follows is the detailed anatomy of these outcomes and the positioning behind the opportunity set moving into 2026.
Market review
A strong year, once again… but marked by sharp volatility
Historically, years following two consecutive 20%+ gains for the S&P 500 — as seen in 2023 and 2024 — have tended to deliver weaker returns. The notable exception was the late-1990s expansion. In 2025, markets followed that historical parallel rather than the more typical post-cycle slowdown.
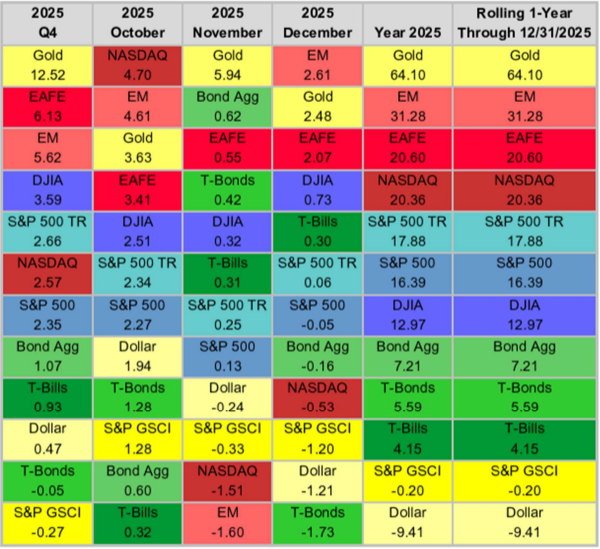
The S&P 500 gained 16.4%, reaching 39 new all-time highs. Technological innovation — particularly in artificial intelligence — was a key driver, drawing frequent comparisons to the 1990s. Unlike that period, however, gains in 2025 were broad-based, both within equities and across asset classes. Nearly all major asset classes rose by at least 5%, the strongest breadth since 2019, with gold advancing 64%, the best year since 1979 and the U.S. Dollar Index falling 9.4%, marking its second-worst year in two decades.
Key Asset Class Trends
The table below summarises returns for 12 asset classes across Q4, each month within the quarter, and year-to-date.
Equity Market & Fund Review
Equity markets in 2025: broad gains, uncomfortable truths
2025 marked a genuine inflection point in global equity markets. After more than a decade of near-uninterrupted US dominance, leadership rotated decisively away from the United States. Japan, Emerging Markets and Europe delivered gains of roughly +32%, +34% and +35%, materially outperforming US equities. Even within global benchmarks, equal-weighted indices outperformed their market-capitalisation counterparts, with the global equal-weighted index (including Emerging Markets) returning +23.3%. Participation broadened, but the comfort of familiar leadership faded.
Currency dynamics amplified the shift. The US dollar entered a clear downcycle, with the Dollar Index (DXY) down 9.4% for the year and nearly 12% against the euro. After years of relative irrelevance, FX returned forcefully to the centre of equity return dynamics, reminding investors that global diversification is never currency-neutral, even when portfolios assume it is.
The year’s defining shock came early. Trump’s “Liberation Day” triggered a sudden 15% drawdown, as markets rushed to price in a US recession. Consensus expectations collapsed with unusual speed. That pessimism proved excessive. Fiscal impulse remained powerful, earnings held up better than feared, and growth expectations were gradually revised higher. The rebound was swift, then reinforced later in the year by the Federal Reserve’s dovish pivot and the start of rate cuts, notably in an economy still operating close to full employment.
Sectors, Styles and factors: trends prevailed
Equity gains in 2025 were broad across styles and capitalisations, but far from uniform. Eight of nine Russell style boxes posted double-digit returns, with mid-cap Growth the notable exception. Large- and small-caps outperformed mid-caps, a relatively rare configuration reflecting investors’ preference for either scale and earnings visibility or cyclical leverage, but little patience for the middle ground.
Sector leadership remained tilted toward Growth, with Technology and Communication Services, again leading for the third consecutive year, driven by semiconductors and platform-centric business models. That said, dispersion remained elevated. Health Care rebounded sharply in Q4, particularly Pharmaceuticals, while Metals & Mining stood out both quarterly and annually, supported by rising metals prices. Real Estate continued to lag, reflecting higher financing costs and muted demand.
Regionally, Emerging Markets were the strongest performers, with leadership broadening beyond China. South Korea stood out, driven by semiconductor exposure. Europe outperformed in USD terms, led by Financials and Utilities, while Japan delivered one of its strongest years in decades, even after currency effects. The US, by contrast, finished among the weaker regions in relative terms, a rare outcome.
Market outlook: a familiar cycle, with important differences
As the world moves further into a multipolar configuration, we believe the USD downcycle is now a structural feature rather than a short-term anomaly. In many respects, the current environment echoes the 2002–2007 cycle, historically favorable to non-US assets, particularly Emerging Market equities and currencies, value-oriented sectors, and selected European industries, notably banks. This cycle, however, is not a simple replay. AI-related equities continue to structurally outperform, reflecting genuine productivity gains rather than speculative excess alone. At the same time, oil prices remain subdued despite geopolitical tensions, due to lasting shifts in global supply dynamics.
Fund Review
For us as portfolio managers, 2025 served as a reminder that regimes change quietly, narratives collapse loudly, and price action rarely waits for consensus to catch up. It was also a year of consolidation and refinement for the NCM Global Equity Selection Fund. Early in the year, Mourtaza Asad-Syed and Charles Gueriteau took over as Portfolio Managers, with a clear objective: reinforce discipline, formalise capital allocation across strategies, and further embed the fund’s antifragile framework into portfolio construction. Same philosophy, clearer strategy, and improved processes.
In a year marked by shifting leadership across regions, styles and currencies, active macro allocation played a meaningful role. We entered 2025 with exposure to China and Emerging Markets, European banks, healthcare and gold miners, while maintaining some cash.
Following the Liberation Day sell-off, once volatility peaked and liquidity conditions stabilised, we increased equity exposure decisively, redeploying cash and rebalancing geographically. Exposure was shifted toward the United States, while European exposure was reduced, and our Emerging Markets bias was refocused on Latin America, where the combination of currencies, commodities and valuations offered a more attractive recovery profile. The portfolio was then positioned to be fully invested into the rebound.
During the summer, we reduced gold miners — in hindsight somewhat early — to reallocate toward Chinese technology stocks, also early in the cycle. At the same time, we neutralised our underweight to the top ten global stocks, whose persistent AI-driven outperformance had created an unsatisfactory level of tracking error. Not every timing decision was perfect, but the majority of macro reallocations proved beneficial and, crucially, helped reduce unintended concentration and regime risks rather than add new ones.
Alongside discretionary decisions, systematic overlay strategies using futures played a central role in shaping the fund’s return profile. Our main long/short market-timing overlay delivered +10.5% in 2025, contributing approximately 200 basis points to fund performance. Over the year, it maintained an average exposure of around 60%, with a 30% long bias, yet ended with zero net market sensitivity (beta), exactly as designed. In parallel, ongoing research into new futures-based models helped refine our existing S&P weekly market-timing framework, with enhancements becoming effective in Q4 and adding incremental performance.
In this environment, the fund delivered a net return of +24.3% in USD, outperforming both the Bloomberg World Net Return Index (+22.1%) and the Developed Markets Equal-Weighted Net Return Index (+20.5%). Since inception in October 2021, the fund has delivered +30.9%, outperforming developed markets equal-weighted equities (+26.7%), while deliberately not matching the most concentrated phases of cap-weighted global indices (+44.4%).
Fund positioning
We enter 2026 with a limited number of discretionary positions in attractively priced assets, consistent with our USD-downcycle scenario. Accordingly, we have increased our bias outside the US, particularly toward Emerging Markets. The fund currently holds a 5% overweight in Emerging Markets versus the reference index, alongside 5% in tactical positions across Nordic markets, European banks, and global refiners.
On the systematic side, overlay exposure is now capped at 30%, reflecting improved robustness and greater confidence in drawdown management. The objective remains unchanged: maintain full participation in long-term equity returns, while shaping the distribution of outcomes through disciplined, repeatable risk management.
Our mandate is simple, but demanding: deliver superior long-term equity performance with reduced drawdowns, by design, not by prediction.
Fixed-income markets & fund review
Market Review
U.S. fixed income delivered its strongest performance in five years in 2025. The Float-Adjusted U.S. Aggregate Bond Index returned +7.2%, benefiting from declining yields and supportive monetary policy.
The 10-year Treasury yield peaked early in the year at 4.79%, fell below 4.00% by October, and ended the year at +4.18%, down 40 basis points despite strong economic growth and ongoing concerns about fiscal deficits. After an extended pause, the Federal Reserve resumed rate cuts in September, delivering three 25 bp reductions and lowering the policy rate to 3.50%–3.75%. As short-term rates fell, cash underperformed other fixed income sectors, though it still produced a solid +4.15% return.
The yield curve steepened meaningfully, with the 10-year minus 2-year Treasury spread widening by 38 basis points, reflecting expectations of slower growth and further policy easing.
Risk-oriented sectors led returns. U.S. dollar–denominated emerging market debt was the top-performing sector, gaining 11.1%, followed by high yield bonds at 8.6%. Agency mortgage-backed securities also performed strongly, returning +8.5%, supported by lower interest rate volatility and declining yields.
For U.S.-based investors, foreign bond markets outperformed domestic bonds, largely due to a weaker USD. The Global Aggregate Float-Adjusted Index returned +8.7%, led by Europe and the U.K. LatAm bonds also contributed strongly, benefiting from a rare combination of tightening credit spreads, receding interest rates, and appreciating currencies. The Asia-Pacific Aggregate ex-China, heavily influenced by Japan, was the only major regional index to decline, as rising yields reflected continued policy normalisation and expectations of fiscal stimulus.
Fund Review
The NCM Fixed Income Opportunities Fund delivered a very strong year, posting a +11.5% return versus +7.2% for the benchmark. Particularly noteworthy was the consecutive streak of 11 positive monthly returns in 2025, which ended only in December. The source of this year’s performance lies in the rare alignment of multiple positive factors within the fund’s portfolio.
Indeed, the asset class itself enjoyed a strong annual performance, but, importantly, all opportunistic segments also generated synchronized positive returns. The steepening of the U.S. yield curve significantly benefited our long-standing position in U.S. steepeners, which represented nearly 7% of portfolio allocation and delivered returns ranging from 10% to 25% over the year.
The legacy bond theme also accelerated during this period, with numerous bonds being called, directly or indirectly benefiting the portfolio by lifting the entire sector. Furthermore, the 9% allocation to the Latin American carry trade theme, via supranational bonds, performed very well in 2025, supported by currency appreciation and interest-rate cuts on top of an already high carry.
Finally, maintaining an average 5% allocation to paper gold—our main structural conviction—proved to be a wise decision and added substantial alpha to the fund’s overall performance.
We are particularly proud that the 2025 results were achieved with a portfolio average rating of A- and an average duration of 4.2 years, implying minimal consumption of the credit and interest rate risk budget.
Looking Forward
We do not believe that 2025 marks a return to favor for bonds as a broad asset class going into 2026. The main reason is that we do not expect a deflationary recession to unfold, at least over the foreseeable horizon of H1. Credit spreads are already very tight, and we expect the U.S. Treasury curve to steepen further, driven by additional Fed rate cuts and a challenging environment for longer maturities. The latter remain constrained by a very dense refinancing calendar and growing disaffection among many of the world’s central banks toward holding U.S. Treasuries.
We believe that remaining highly opportunistic and flexible will allow us to deliver another successful year ahead. Accordingly, as we enter 2026, the portfolio will continue to be calibrated largely in line with the positioning of the past 12 months.
The Latin American political calendar should prove supportive of further gains in both bonds and currencies as the region continues to shift to the right. U.S. involvement in the region may, however, have dual and potentially opposing effects. On the one hand, strong resentment toward the U.S. among Central and South American countries could penalize right-wing parties, reducing the probability of a political swing to the right. On the other hand, U.S. proximity and engagement have historically acted as a catalyst for financial markets, as seen in Argentina.
Fund Positioning
For the time being, we will continue to hold and further reinforce our steepener allocation for the reasons outlined above. We will also increase our conviction in the energy theme, as we believe it can materially enhance the strategy’s antifragility. As the world moves increasingly toward a Ricardian survival framework, the accumulation of storable commodities of all kinds becomes a priority. We aim to capitalise on this trend by adding to and extending credit duration in energy and materials names.
Precious Markets & Fund Review
Market Review
2025 stands as one of the strongest years on record for precious metals. Performance across the complex reflected a sustained shift toward hard assets amid declining confidence in the global monetary system and ongoing fiat currency debasement. Rather than being driven by episodic shocks or short-term macro volatility, the year marked a structural change in how precious metals are priced, held, and allocated, increasingly treated as strategic assets supported by persistent institutional, sovereign, and private demand.
Gold rose 64.1% over the year, recording close to 50 all-time highs, despite broadly constructive risk sentiment and rising equity markets. This confirmed that gold’s advance was allocation-driven rather than fear-driven. The reintroduction of U.S. trade tariffs revived concerns around global trade fragmentation, inflation pass-through, and retaliatory policy risk, unfolding against a backdrop of fiscal dominance where elevated public debt constrained central banks’ ability to respond to inflation.
Central-bank demand remained a dominant, price-insensitive force. For the third consecutive year, official-sector gold purchases exceeded 1’000 tonnes, led by emerging-market central banks seeking reserve diversification and reduced reliance on U.S. Treasuries. Private demand increasingly favored allocated and physically segregated gold, resulting in shallow corrections and compressed volatility. Gold progressively traded less as a tactical hedge and more as a monetary asset and strategic collateral.
Silver was the standout performer of 2025, delivering an exceptional +147% annual return and entering a clear phase of price discovery. Unlike previous rallies, the move was driven by persistent physical tightness and a growing divergence between paper and physical markets. The CME raised margin requirements twice, ultimately increasing initial margins to USD 32’500 per contract, including a significant adjustment during the low-liquidity year-end period. Historically, such measures triggered sharp corrections – in 2025, silver experienced only brief and contained pullbacks, signaling a shift toward long-term structural holders.
Physical dislocations became increasingly visible. In Japan, physical silver traded near USD 130 per ounce, versus paper spot prices around USD 75, reflecting acute regional scarcity. Recycling offered little relief, with estimated costs between USD 150 and USD 200 per ounce, rendering it largely uneconomic at prevailing prices. With less than 30% of global supply originating from primary silver mines, supply remained highly inelastic. Industrial demand further reinforced this imbalance, as silver’s unmatched electrical and thermal conductivity limited substitution across photovoltaics, electrification, and advanced electronics.
Platinum delivered one of its strongest annual performances in decades, driven by chronic supply constraints, particularly in South Africa, which accounts for over 70% of global production. Power shortages, operational disruptions, and weak recycling kept supply tight, while demand benefited from hydrogen-related applications and substitution effects versus gold. Palladium’s performance was more contained but stabilised as mine output declined, recycling disappointed, and geopolitical risk linked to Russia’s dominant supply position sustained a latent risk premium.
In conclusion, the 2025 rally in precious metals was not speculative excess, but the result of policy actions, market-structure frictions, and physical supply constraints. Trade tariffs, export controls, margin increases, and a growing preference for physical ownership reshaped price formation, establishing a new structural baseline in which precious metals respond less to short-term macro signals and more to policy credibility, supply control, and physical scarcity.
Fund Review
The Fund closed 2025 with an exceptional +90% annual performance, an unprecedented result that significantly outperformed both active and passive gold-based strategies. Over the same period, gold appreciated by 65%, implying that our Core–Satellite active strategy generated +25 percentage points of excess return relative to the yellow metal.
This outcome reflects disciplined positioning, dynamic risk management, and a deliberate allocation toward metals and strategies offering the most attractive asymmetric return profiles.
Gold: The Core Exposure
Gold remained the structural anchor of the portfolio throughout the year. While our long exposure to gold was maintained close to 100% on average, our total net exposure fluctuated materially as we actively adjusted risk in response to market conditions.
Despite remaining fundamentally constructive on gold, the parabolic price action, combined with extreme overbought technical signals, prompted us to implement a hedging program at several points during the year. This was achieved through digital option structures, designed to benefit from elevated spot sensitivity with high delta exposure, and long put positions. Both aimed at protecting against sharp corrections.
The cost of this hedging program amounted to approximately –7 percentage points of performance in 2025. While this detracted from returns in a strongly trending market, it materially reduced portfolio volatility and downside risk, fully consistent with the core objective of our antifragile, tail-risk-aware investment framework. In our view, sacrificing a portion of upside to preserve convexity and capital integrity remains a defining feature of long-term compounding.
Silver and PGMs: The Main Alpha Engine
Beyond gold, silver and Platinum Group Metals (PGMs) were our highest-conviction themes for 2025 and the primary drivers of alpha generation.
We increased our average net exposure to non-gold precious metals to approximately 40%, with around 25% allocated to silver alone, reflecting our strong conviction in its dual monetary and industrial dynamics. Silver, platinum, and palladium together contributed +38 percentage points to the Fund’s annual performance.
Returns were generated predominantly through long directional positions, as the macro and fundamental backdrop, persistent inflation pressures, supply-side constraints, and accelerating industrial demand, proved particularly supportive. In contrast to prior years, we materially reduced our short options activity, as volatility levels remained unattractive and skew dynamics offered limited compensation for risk.
Silver and PGMs demonstrated their ability to outperform gold in reflationary and supply-constrained environments, validating their role as high-beta satellites within the precious metals allocation.
Foreign Exchange: A Low-Volatility Diversifier
On the foreign exchange side, our exposure to Latin American high-carry currencies delivered both diversification and positive returns. Although the +2 percentage points contribution was modest in absolute terms, it should be viewed in perspective given an average portfolio exposure of just 9%, highlighting the efficiency of this allocation as a return-enhancing diversifier.
Conversely, our long Japanese yen position had a slightly negative impact on performance due to its negative carry against USD. Nonetheless, we deliberately maintained this exposure, as the JPY continues to serve as a strategic hedge against a potential large-scale capital repatriation by Japanese investors, a scenario that could exert downward pressure on gold prices and PMs in general.
Miscellaneous: Opportunistic and Decorrelated Trades
In parallel, we continued to actively monitor markets for opportunistic, decorrelated strategies offering compelling risk/return profiles. In this context, one of our most notable tactical positions in 2025 was the sale of short put options on Brent crude oil, where elevated volatility levels and pronounced backwardation created attractive conditions.
These positions were designed to complement the core portfolio by capturing idiosyncratic return streams with limited correlation to precious metals.
Conclusion
2025 was characterised by strong directional trends and an exceptional performance across the precious metals complex. Within this favorable environment, the Fund delivered outstanding results by combining conviction-driven positioning, active risk management, and a disciplined Core–Satellite framework. The result was not only strong absolute returns, but also a portfolio construction that remained antifragile, adaptive, and aligned with our long-term investment philosophy.
Looking Forward – Precious Metals: Entering the Core Phase of the Cycle
Our constructive view on precious metals has strengthened further. What began as a repricing driven by macro uncertainty is increasingly evolving into a structural bull market across the entire complex, supported by inflation persistence, fiscal dominance, de-dollarisation, and tightening physical supply. While gold remains the anchor, silver stands out again as our highest-conviction opportunity for 2026, combining monetary attributes with acute industrial scarcity.
Gold: Astructural Repricing of Monetary Trust
Gold’s recent behavior reflects a profound shift in the global monetary architecture. The medium-term trajectory toward USD 5’000 per ounce and beyond remains consistent with the structural forces now shaping the macroeconomic environment.
The global economy is increasingly operating under a regime of fiscal dominance, where the sustainability of public debt constrains central banks’ ability to combat inflation decisively. As a result, real interest rates are structurally capped, reinforcing gold’s role as a long-term store of value. At the same time, de-dollarisation continues to accelerate and gold’s function as reserve assets, insulated from sanctions, political pressure, and counterparty risk is increasingly embedded in Central Banks’ reserve management, primarily in emerging economies, and long-term asset allocation.
The strength of the U.S. dollar increasingly reflects interest-rate differentials rather than durable confidence. Expanding fiscal deficits, rising debt-servicing costs, and growing political influence over monetary policy continue to erode its long-term credibility. Even at recent highs, gold remains relatively undervalued when measured against global money supply growth and the valuation of financial assets, particularly equities.
In an increasingly fragmented geopolitical landscape, gold is reasserting itself as non-sovereign, non-digital collateral, trusted by both states and private investors. It is no longer trading merely as an inflation hedge, but as a monetary alternative in an environment of weakening institutional trust.
Silver: The Core Conviction for 2026
Silver remains our highest-conviction precious metal, offering asymmetric upside through the convergence of monetary demand, industrial necessity, and a deepening structural supply deficit.
Although the gold–silver ratio has compressed meaningfully, it remains well above its long-term equilibrium, suggesting further relative upside as capital broadens beyond gold. Investment and safe-haven demand continue to build, driven by the same macro forces supporting gold, but amplified by silver’s lower nominal price and historically higher beta.
More importantly, industrial demand has become a structural pillar. The rapid global expansion of solar photovoltaic capacity is locking in a durable source of silver consumption. Gains from thrifting are increasingly marginal, while next-generation, high-efficiency panel technologies rely on more silver-intensive metallisation to achieve higher performance and durability. This trend is reinforced by accelerating demand from electrification, electric-vehicle infrastructure, and advanced electronics, where substitution remains limited.
On the supply side, the imbalance is persistent. Less than 30% of global silver production comes from primary mines, leaving supply highly inelastic. Recycling growth remains constrained, as a significant portion of silver is embedded in price-insensitive industrial applications and declining ore grades continue to limit recovery efficiency. Adding to these constraints, China’s recent introduction of export licensing requirements for silver, notably as the world’s largest net exporter of refined silver, with annual flows of approximately 120 million ounces, has introduced additional uncertainty into global supply chains.
While volatility is likely to remain elevated, pullbacks are increasingly shallow and quickly met by physical demand. In our view, this is not late-cycle exuberance, but early-cycle repricing.
Platinum: Supply Discipline Meets Structural Demand
Platinum continues to benefit from a rare combination of tight supply, expanding end-use demand, and supportive relative valuation. Global production remains structurally constrained, as we saw in the Market Review and recycling flows, particularly from autocatalysts, remain subdued.
At the same time, demand is broadening beyond traditional automotive applications. Hydrogen-related technologies, including electrolyzers and fuel cells, are transitioning from pilot phases toward industrial deployment. Substitution effects in jewelry and industrial uses are also accelerating, supported by platinum’s substantial price discount relative to gold. Investor interest is gradually returning as platinum’s strategic role in the energy transition becomes more visible and better understood.
Despite strong recent performance, platinum remains undervalued relative to its scarcity and strategic importance, with further upside potential as structural deficits persist.
Palladium: Optionality with Asymmetric Risk
Palladium remains the most complex metal within the precious metals spectrum. Supply expectations have tightened meaningfully, as projected surpluses have been deferred due to declining mine output and disappointing recycling growth. Periodic safe-haven flows have also supported prices alongside broader strength in precious metals.
However, long-term demand visibility remains challenged. Ongoing substitution by platinum in catalytic converters and the structural decline of internal combustion engine production as electric-vehicle penetration rises continue to weigh on the outlook. Nevertheless, geopolitical risk remains a latent catalyst. Russia’s dominant role in global supply introduces asymmetric upside risk, as any sanctions or supply disruptions could trigger sharp price moves.
While palladium lacks the structural clarity of gold, silver, or platinum, it retains optionality in a tightening physical market and remains relevant as a tactical allocation.
Conclusion
Precious metals are no longer merely reacting to macroeconomic uncertainty, they are repricing a new global regime defined by persistent inflation, fiscal dominance, geopolitical fragmentation, and structural supply constraints. We believe the next phase of the cycle will be characterised not by speculative excess, but by a sustained rotation of capital toward tangible assets with genuine scarcity. In this environment, precious metals remain strategically indispensable.
Strategic Thinking – True Long-Term Diversification
In quantitative finance, correlations are treated as solid anchors: measurable, updated daily, and conveniently fed into portfolio-optimisation models. Yet correlations are far more fragile than they appear — and, depending on how we measure them, they often tell completely different stories. The industry’s reliance on high-frequency data creates an illusion of diversification that quietly shapes entire asset-allocation frameworks in the wrong direction.
This issue isn’t new. Since Markowitz, portfolio theory has rested on the idea that diversification emerges from combining assets whose returns are not perfectly aligned. But the theory never prescribed which frequencies should be used to measure that alignment. Over time, operational convenience took over: daily or weekly data became standard inputs, simply because they were easy to obtain and statistically abundant.
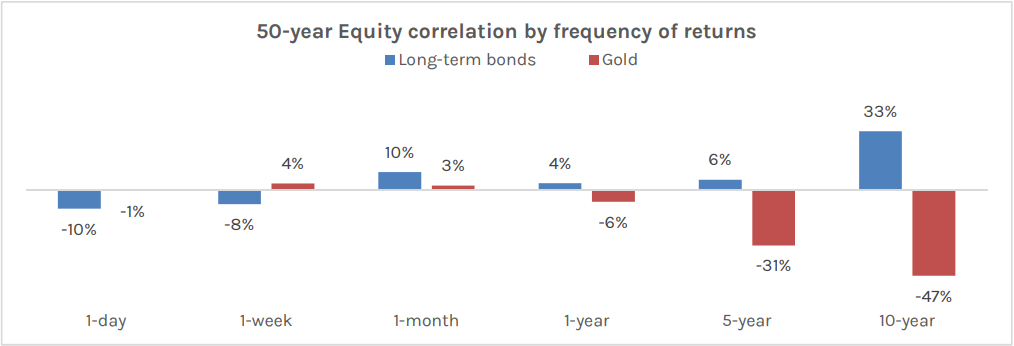
The problem is that markets don’t behave at daily intervals — investors do. Over long investment horizons, what matters is not whether assets move together every day, but whether they preserve independence over cycles. And on that front, the academic literature is clear: correlations measured at short frequencies tend to be misleading. Studies in market microstructure, temporal aggregation, and long-horizon risk show that daily correlations exaggerate co-movement between assets, while multi-year correlations paint a very different picture.
A simple example illustrates the point. Take equities and real estate, or equities and gold. On a daily or weekly basis, correlations appear high or erratic — often leading to portfolio models that converge mechanically toward the classic “equity–bond” mix. But stretch the horizon to multi-year returns, and the relationship changes dramatically. Long-cycle correlations between equities and real assets are much lower, and far more stable. In other words, the very assets dismissed as “poor diversifiers” at high frequency turn out to be meaningful diversifiers over the natural horizon of institutional investors.
This is not just a statistical curiosity — it directly impacts portfolio construction. Optimising a portfolio on high-frequency correlations inevitably underweights real diversification assets such as gold, real estate, or commodities. It pushes allocations toward assets that look uncorrelated at a daily horizon but converge in crises. Conversely, when one uses long-horizon correlations consistent with a 5- to 10-year investment perspective, optimal portfolios shift: they contain more real assets, more defensives, and a more balanced mix of risk factors.
The message is simple: portfolio construction should reflect investment horizons, not data availability. Measuring correlations at a frequency aligned with long-term objectives leads to allocations that are more resilient, better diversified, and less dependent on the daily noise that dominates modern market practice.
It’s not about rewriting Markowitz — it’s about applying his insights through the appropriate lens.
Hans Ulriksen, CEO and Fund Manager Christopher Boudin de l’Arche, Fund Manager
Legal information
This document is intended for information and/or marketing purposes only. It is not intended for distribution to, or use by, any person or entity who is a citizen or resident of any locality, state, country or jurisdiction where such distribution, publication, availability or use would be contrary to law or regulation. This document is not an offering memorandum and should not be considered a solicitation to purchase or invest in Noble Capital Management (NCM SA).
Disclaimer
NCM Enhanced Physical Gold Macro is a sub-fund of “NCM Alternative Assets, fonds à risque particulier” which is a contractual umbrella fund under Swiss law in the “other funds for alternative investments” category with specific risks. The sub-fund uses investment techniques whose risks cannot be compared with those of funds with traditional investments; in particular, the sub-funds may have significant leverage. Investors must be prepared to bear potential capital losses, which may be substantial or total. However, the fund management company and the asset manager endeavour to minimize these risks. In addition to market and currency risks, investors should be aware of risks relating to management, the negotiability of units, the liquidity of investments, the impact of redemptions, unit prices, service providers, lack of transparency and legal matters. These risks are detailed on pages 24 et 25 of the contractual fund.
Past performance is not a guide to future performance. Do remember that the value of an investment and the income generated from them can fall as well as rise and is not guaranteed, therefore, you may not get back the amount originally invested and potentially risk total loss of capital.
For a comprehensive list of risks involved in investing in the NCM Enhanced Physical Gold Macro Fund, please refer to the Appendix of the Fund Contract. If you have any doubts about the suitability of an investment, please consult a financial adviser.
The information and opinions contained herein are provided for information and advertising purposes only. It does not constitute a financial service or an offer under the Swiss Federal Law on Financial Services (FinSA). In particular, this document is neither an advice on investment nor a recommendation or offer or invitation to make an offer with respect to the purchase or sale of the sub-fund and shall not be construed as such. Further, this document shall not be construed as legal, tax, regulatory, accounting or other advice.
The terms and conditions, the risk information and other details on the sub-fund are contained in the fund documentation, in particular the Fund Contract and its Appendix. The Fund Contract and the Appendix of the NCM Enhanced Physical Gold Macro Fund as well as the annual reports and any other product documentation may be obtained on request and free of charge from Noble Capital Management (NCM) SA or the fund management company.
This document has been prepared based on sources of information considered to be reliable and accurate. However, the information contained herein is subject to change without notice and this document may not contain all material information regarding the financial instruments concerned. No representation or warranty is made as to the fairness, accuracy, completeness or correctness of the information contained herein. Noble Capital Management (NCM) SA is under no obligation to update, revise or affirm this document following subsequent developments.
0 Comments