Quarterly investors letter – Q3 2023
What an unusual combination!
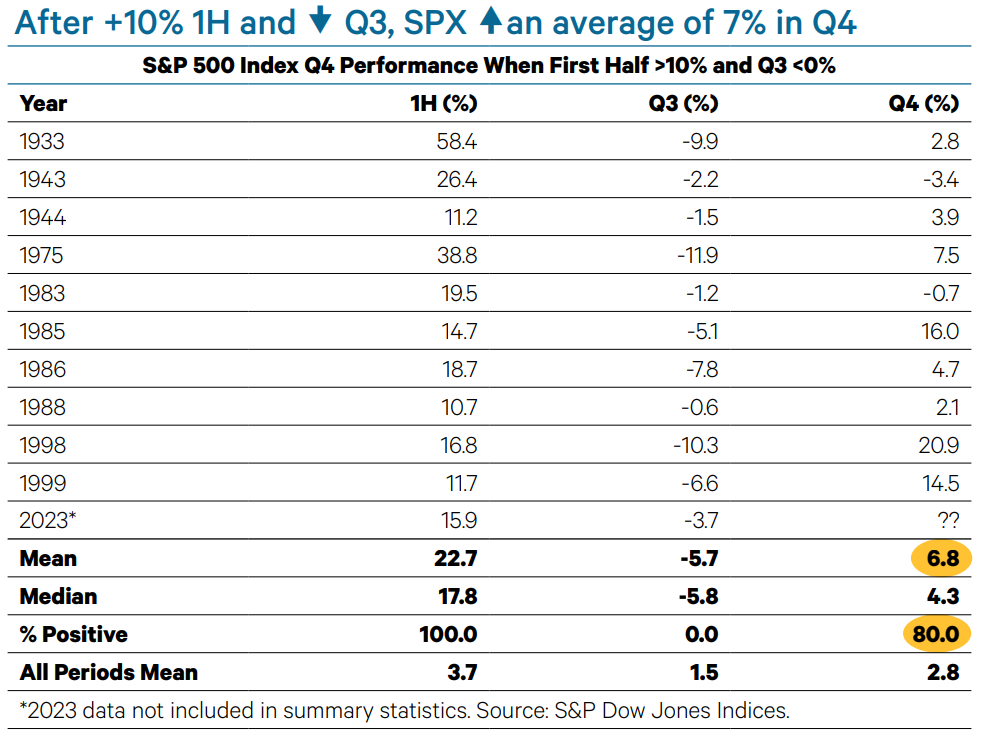
After a torrid start to the year, equities pulled back in the third quarter. Not only did the S&P 500 Index post its first negative quarter since Q3 2022, all nine Russell style boxes, nine out of 11 S&P 500 sectors, and five out of seven MSCI major country/region indices fell in Q3. Pinning the direction of the $43 trillion U.S. stock market on any one factor would be an oversimplification, but the overarching theme of the third quarter was the transition from relief that a U.S. recession was not imminent to uncertainty over what stronger-than-expected growth and potentially troughing inflation rates mean for monetary policy. The macro backdrop also explains why economically-sensitive commodities and the Energy sector outperformed while inflation-sensitive bonds underperformed in Q3. Long-term Treasuries posted their fourth worst quarter since 1926! Whether the leadership rotation in the third quarter proves to be a hiatus before a return to first half trends or a cyclical shift will likely depend on the macro backdrop. From a purely historical perspective, a pause has become more likely. Last quarter, we discussed what would be the S&P 500 Index performance after the index gained at least 10% in the first half. Gains continued in the second half, albeit at a slower pace. The table below adds an additional criterion: a down third quarter. Since 1926, the S&P 500 has risen eight out of 10 times by an average of 6.8% in Q4 versus a mean of 2.8% for all fourth quarters.
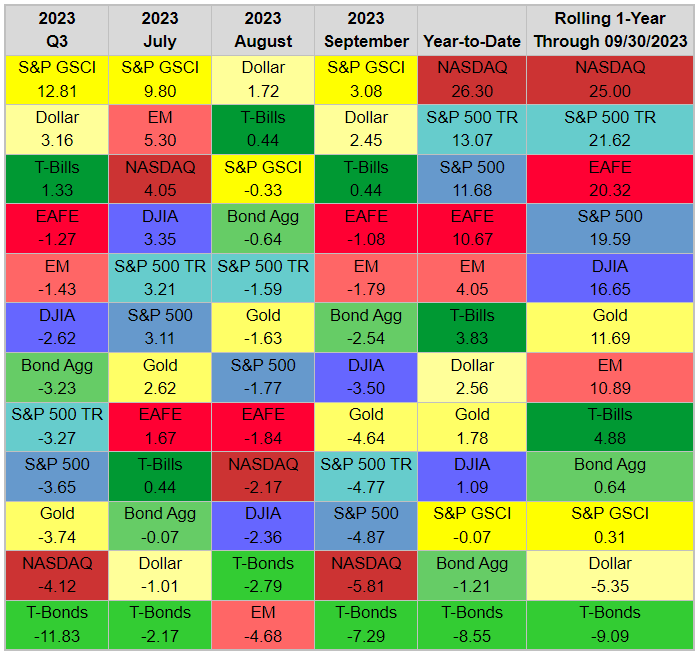
The S&P Commodity Index topped the asset class-ranking table with a 12.8% gain in Q3. Commodities beat stocks and bonds in each month of the quarter. The S&P GSCI is production-weighted, so it was aided by crude oil’s 22.4% surge. Still, gains were broad-based. Simultaneously, the U.S. Dollar Index claimed the second spot in the table with a 3.2% gain in Q3. As with many other asset classes, the dollar continued its first-half trend in July, before reversing in August and September. Cash was almost the king this quarter. T-bills were the only other asset class in the green in Q3. The 1.3% gain was the highest since Q4 2000. Whether stocks or bonds outperformed in Q3 depended on the benchmark. The Bloomberg U.S. Agg topped the S&P 500 by four basis points (bp). The DJIA beat the Agg by 61 bp, but the Nasdaq trailed the Agg by 89 bp. Long-term Treasury bonds were the worst asset class in the table, tumbling 11.9%. Gold was the third worst asset class in Q3, falling 3.7%. The yellow metal mirrored the dollar, gaining in July but giving it back in August and September.
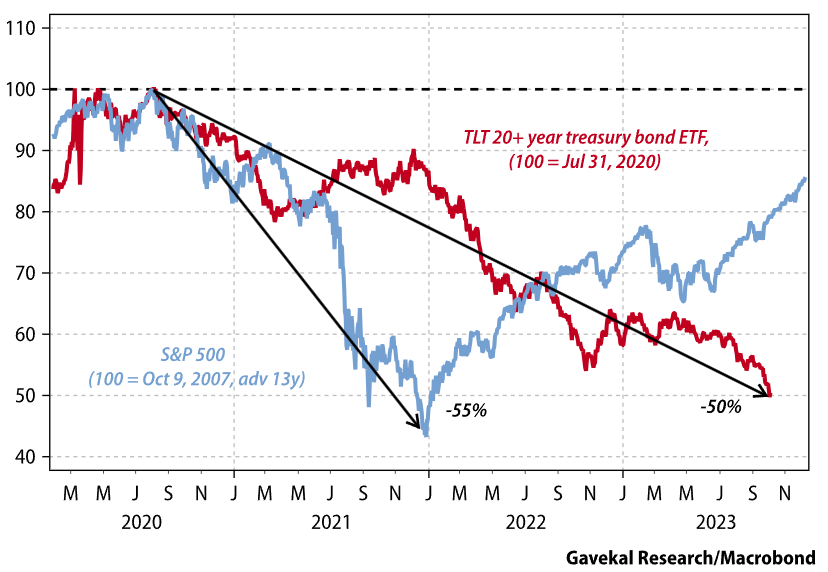
With no doubt, the striking figure of the above table (but the same could be said in 21 and 22) is the T-Bonds return. We have now clearly entered the meltdown phase of the investment cycle at the long-end of OECD bond markets. The TLT 20+ year treasury bond ETF is now down -50% from its July 31, 2020 high. In terms of absolute performance, it is almost equivalent to the -57% drop in the S&P 500 during the 2007-09 crisis. Given that government bonds lie at the very heart of the global financial system, it would be naïve to expect that a crash of this magnitude will not have far-ranging repercussions.
The bond sell-off is now having an impact on corporate debt, and spreads are starting to widen. For example, high yield spreads have gapped 50bp in the past two weeks. Equities too are selling off, with the more defensive sectors selling off even more aggressively. It’s not just utilities. Recent days have seen significant sell-offs in assets such as gold and silver, generally considered as “portfolio insurance.”
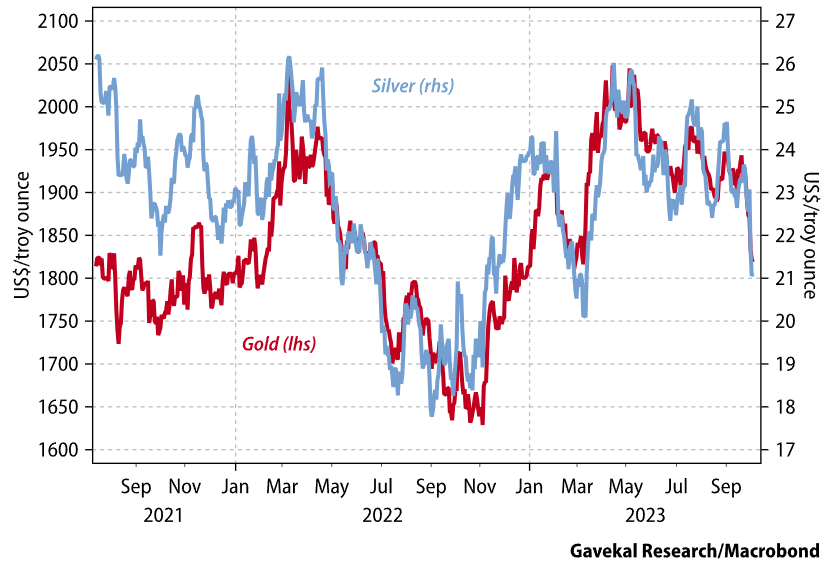
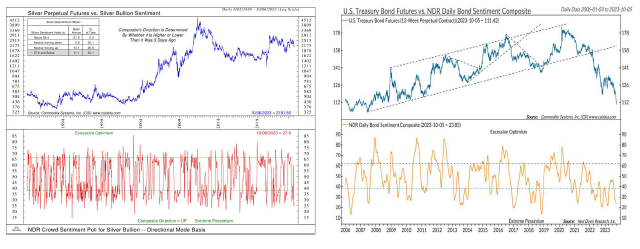
In a crisis, the only things that rise are correlations. In 2008, the only thing that mattered was US mortgage spreads. In 2011-12, it was the Italian bond spread (which may now be making a comeback as a concern). In 2015-16, it was the renminbi’s exchange rate. Every now and then, one factor dominates all others, and markets enter the riot phase. This is where we are now with bonds. We are in the riot phase in which correlations go to one, and selling begets more selling—not for any fundamental reason, but simply because the main driver of tomorrow’s asset price is today’s asset price. This said, several asset classes we watch closely are getting in extreme pessimism zone (i.e., are oversold). That is true about long-dated bonds or gold and silver. Mirroring that effect, the DXY Index sits at the opposite.
The NCM Enhanced Physical Gold fund had a disappointing performance in September for all the above-detailed drivers. Stepping into Q4 seasonality, the adverse factors should become tailwinds, reinforced by the fact that as we move towards 2024, odds that market participants increase the FED pivot bets are rising. At that point, the fund’s convexity should play out again in full and we expect a revival of last year’s strong last quarter performance.
We would like to thank our long-lasting research partners, GaveKal Research, Vincent Deluard, CFA StoneX and Ned Davis Research for their highly valuable contribution.
Sincerely yours,
Hans Ulriksen, CEO
Legal information
This document is intended for information and/or marketing purposes only. It is not intended for distribution to, or use by, any person or entity who is a citizen or resident of any locality, state, country or jurisdiction where such distribution, publication, availability or use would be contrary to law or regulation. This document is not an offering memorandum and should not be considered a solicitation to purchase or invest in Noble Capital Management (NCM SA.
Disclaimer
NCM Enhanced Physical Gold Macro is a sub-fund of “NCM Alternative Assets, fonds à risque particulier” which is a contractual umbrella fund under Swiss law in the “other funds for alternative investments” category with specific risks. The sub-fund uses investment techniques whose risks cannot be compared with those of funds with traditional investments; in particular, the sub-funds may have significant leverage. Investors must be prepared to bear potential capital losses, which may be substantial or total. However, the fund management company and the asset manager endeavour to minimize these risks. In addition to market and currency risks, investors should be aware of risks relating to management, the negotiability of units, the liquidity of investments, the impact of redemptions, unit prices, service providers, lack of transparency and legal matters. These risks are detailed on pages 24 et 25 of the contractual fund.
Past performance is not a guide to future performance. Do remember that the value of an investment and the income generated from them can fall as well as rise and is not guaranteed, therefore, you may not get back the amount originally invested and potentially risk total loss of capital.
For a comprehensive list of risks involved in investing in the NCM Enhanced Physical Gold Macro Fund, please refer to the Appendix of the Fund Contract. If you have any doubts about the suitability of an investment, please consult a financial adviser.
The information and opinions contained herein are provided for information and advertising purposes only. It does not constitute a financial service or an offer under the Swiss Federal Law on Financial Services (FinSA). In particular, this document is neither an advice on investment nor a recommendation or offer or invitation to make an offer with respect to the purchase or sale of the sub-fund and shall not be construed as such. Further, this document shall not be construed as legal, tax, regulatory, accounting or other advice.
The terms and conditions, the risk information and other details on the sub-fund are contained in the fund documentation, in particular the Fund Contract and its Appendix. The Fund Contract and the Appendix of the NCM Enhanced Physical Gold Macro Fund as well as the annual reports and any other product documentation may be obtained on request and free of charge from Noble Capital Management (NCM) SA or the fund management company.
This document has been prepared based on sources of information considered to be reliable and accurate. However, the information contained herein is subject to change without notice and this document may not contain all material information regarding the financial instruments concerned. No representation or warranty is made as to the fairness, accuracy, completeness or correctness of the information contained herein. Noble Capital Management (NCM) SA is under no obligation to update, revise or affirm this document following subsequent developments.
0 Comments