Quarterly investors letter – Q2 2024
Market review
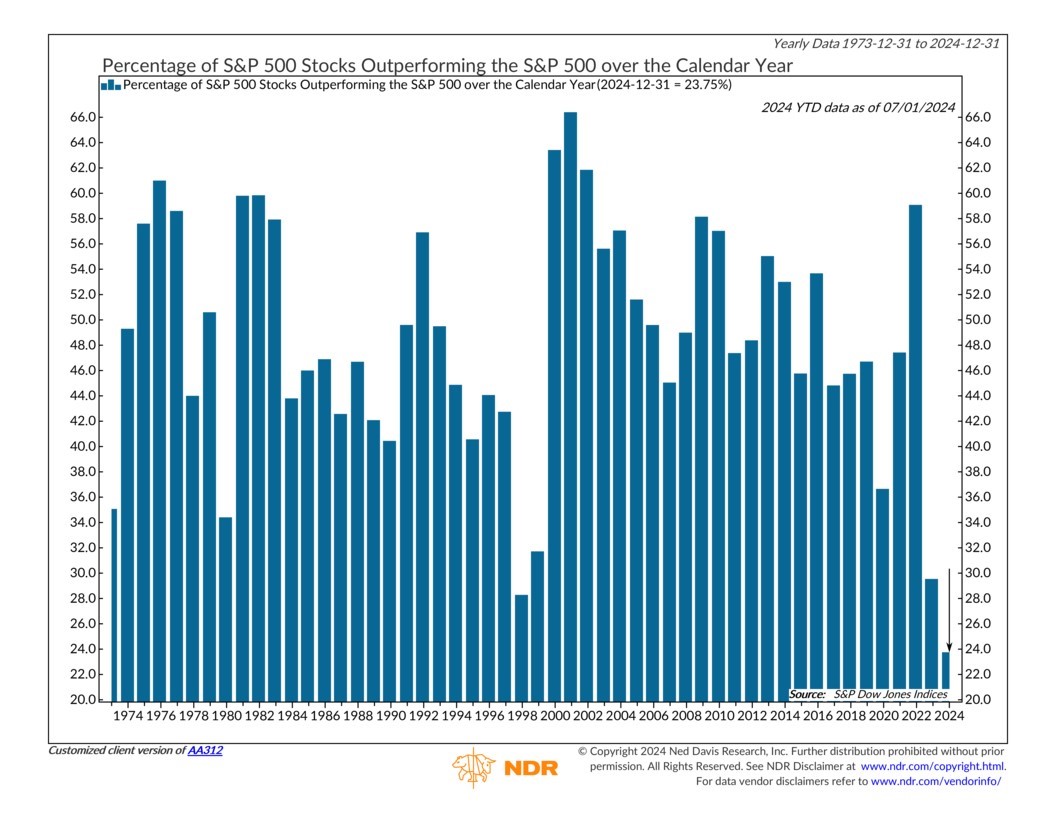
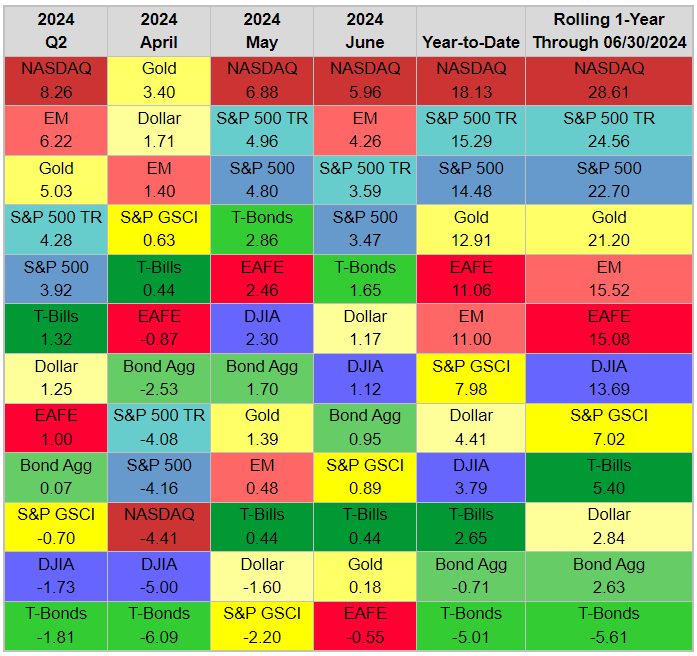
It is highly misleading looking at equity returns in Q2 and year-to-date to conclude the investment environment was an easy ride. Indeed, market-cap weighted equity indices outperformed other asset classes in Q2. Year-to-date, the S&P 500 surged 14.5%, the second-best start to an election year since 1928 and it also beat the Bloomberg Bond Aggregate by 15.9%. The relative performance statistics at the index level imply that a small number of stocks outperformed. Less than 24% of stocks have outperformed the S&P 500 year-to-date, putting it on pace for the lowest percentage since at least 1973. While the Nasdaq was the best benchmark in the table in Q2 with an 8.3% gain, the DJIA was the second worst at -1.7%. The 14.3% points spread YTD is the sixth most since 1972 but pales in comparison to last year’s 27.9% 1H.
So stocks beat bonds across the board and long-term bonds fared worse within that asset class, falling 5.0% in the first half and trailing the S&P 500 by 20.3%.
The S&P GSCI (Commodity Index) slipped 0.7% in Q2 but is still up 8.0% on the year. The S&P GSCI is production-weighted, so crude oil’s 2.3% drop in Q1 weighed on the benchmark. The equal-weighted Reuters/CCI gained 0.1% in Q2 and is up 10.1% on the year. Gold continued to outpace most other commodities, adding 5.0% in Q2 to bring its YTD gain to 12.9%. Gold and the dollar are normally negatively correlated, but the greenback added 1.3% in Q2 and is up 4.4% through the first half of the year. Fears over sticky inflation, delayed Fed rate cuts, and easing by other central banks combined to benefit both the dollar and gold. The delay in Fed rate cuts also meaning that returns on cash remain historically high. T-bills posted their best first half since 2000.
Our take
Since few quarters now we have been emphasizing the lunacy of the 2% inflation target or in other terms the implication for the 60/40 balanced portfolio; i.e. the dead of it!
As shown in the asset classes return analysis above, the 40% fixed income portion of that portfolio stopped working three years ago now and we will show you why we believe it still will be the case for the foreseeable future. Do not get us wrong, we do not believe in the forecast business as such; we, in the asset management business, thrive in spotting regime changes and adapt our diversification strategies in order to weather the changing economic cycles and profit from it. As our long-lasting research partners and we have been arguing, maintaining a classical balanced portfolio is a road to ruin, if we are duly moving back into an inflationary period. In the 1970s, investors who kept 60-40 allocations between bonds and equities lost about 50% in real terms in the following decade. If, as we believe, the world is moving into an environment of structurally higher inflation, there is no reason to think that the same might not occur again. The time of switching to a “stay rich” investment style rather than “get rich” allocation will soon celebrate its third anniversary, so it becomes urgent not to wait until it gets its driving licence to adopt it, it might be too late to preserve whatsoever wealth by that time. In order to assimilate the “stay rich” portfolio approach it is worth recalling Nassim Taleb’s concepts of fragility, antifragility and robustness.
- A fragile asset’s value tends to fall if its price volatility rises. The stock market is fragile, and so is the bond market in inflationary periods.
- An antifragile asset sees its price rising when its volatility goes up. Some examples of antifragile assets are gold in inflationary periods and government bonds in non-inflationary times.
- A robust asset does not see its price move whatever happens in the economy. Cash in local currency terms is a robust asset.
Market reaction function works pretty well based on the different economic cycles.
- If we are in the deflationary phase, gold goes nowhere if the stock market collapses, but bonds go up and cash does not move.
- If we are in the inflationary camp and the stock market gets agitated, bonds do not work as a hedge anymore, gold goes up and cash goes nowhere.
So, the stock market is always protected by a robust asset—cash—and an antifragile asset—either gold or bonds. The net result is a portfolio which is as robust as cash, but which yields handsomely more than cash. A dynamically-managed protected portfolio will therefore follow a rule-based allocation process, driven by the extent of real yields’ absolute value; the lower the real yields, the higher the allocation to gold vs bonds and vice versa. Vincent Deluard from StoneX, rightly suggest alternatives to the gold allocation by mean of inflation breakeven, floating rate notes, bank loans or MLPs. However, he recognizes that gold has the additional diversification advantage of hedging geopolitical and financial repression risk on top of the inflationary threat. He adds that despite its volatility, silver should be part of the macro hedge bucket because it offers leverage on positive macro surprises, such as a sustained period of rapid industrial growth driven by a continued investment in semiconductors, solar panels, and batteries; in short, a lot of what NCM has in its own Enhanced Physical Gold Macro Fund.
At this stage, a key question is, in which inflationary regime are we? And how central banks will respond to it (i.e. where are real yields heading)?
In this regard, Anatole Kaletsky at GaveKal reiterated recently a very straightforward response to this. Recent benign inflation data has led many analysts to believe that central banks such as the US Federal Reserve, the European Central Bank, and the Bank of England are nearing price stability and may soon pivot towards stimulating employment and economic growth. However, despite a drop in US PCE inflation to 2.6% in May and similar figures in the Eurozone and the UK, long-term risks to inflation remain skewed upwards.
Even if upcoming data shows moderated inflation, the long-term trend is expected to reverse the deflationary trend from 1980 to 2020, moving towards sustained inflation due to several structural factors.
Key Drivers of Long-term Inflation:
- Deglobalization: Trade blocs and regional supply chains reduce global competition, leading to less disinflationary pressure than seen post-China’s WTO entry.
- Demographics: Aging populations in the US, Europe, and Japan will increase demand for healthcare and pensions, expanding government deficits and fuelling wage inflation due to labour shortages.
- Politics: Income redistribution policies favouring low and middle-income earners, combined with corporate concentration and protectionism, are likely to cause wage-price spirals.
- Militarism: Increased defence spending and demographic demands will heighten fiscal pressures, echoing inflationary periods like the Vietnam War era.
- Environmentalism: Investments in alternative energy will drive commodity prices up and reduce global energy supply during the transition period.
- Technology: Dominance of tech monopolies like Google and Amazon allows significant pricing power, and while AI’s cost-saving potential is uncertain, it is unlikely to match the disinflationary impact of past technological revolutions.
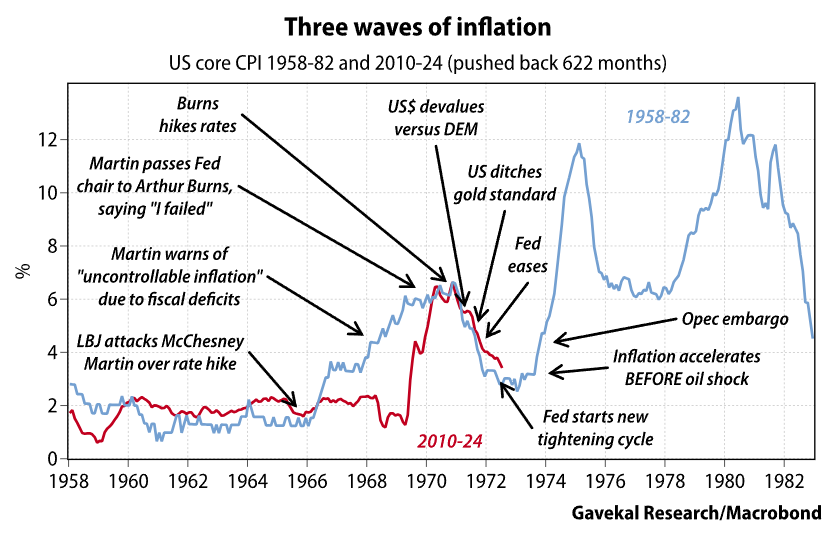
Monetarism and Rational Expectations have dominated the last 40 years’ financial wisdom. Traditional economic theories suggest central banks can control inflation through monetary policy and that rational agents will align their expectations with central bank targets. However, evidence and recent macroeconomic changes challenge this view, suggesting inflation will not easily return to the 2% target. This inflation target is now more of a floor than a ceiling, indicating that average inflation could be around 3% or 4% over the economic cycle. Even this rosy scenario may prove to be just an interlude before another wave of much higher inflation. The great inflation of the 1970s occurred in three waves, as shown in the chart below—and the decline of core inflation since its peak in 2022 tracked very closely the first wave of that dreadful period.
With the US bond market currently pricing-in breakeven inflation at just under 2.3% over the next 5, 10 and 30 years in terms of CPI. That is equivalent to less than 1.9% average PCE inflation for the next 30 years. This looks like a very serious mispricing. It suggests that the global investment community is still heavily overexposed to bond duration risk and very underweight inflation-hedge assets, an amazing opportunity!
NCM Enhanced Physical Gold Macro Fund Review:
The fund has once again recorded a positive quarter, outperforming gold by nearly 10 percentage points since inception. The year-to-date (YTD) performance stands at +15% for the USD share class and +22% YTD for the CHF share class.
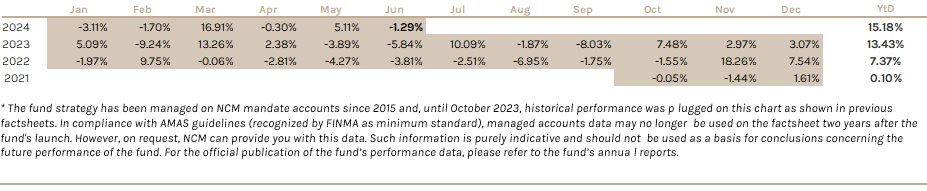
This strong outperformance is driven by i) our structurally convex portfolio, which provides rapid upside acceleration, and ii) our strategic long exposure to silver, a high beta proxy for gold. Our continuous efforts to optimize the fund’s “antifragile” characteristic led us to hedge 50% of our gold exposure through a long put strategy with a $2,400 strike price. This significant adjustment does not indicate a shift in our long-term outlook for gold. However, our short-term models have moderated their bullish tone following an overbought situation, and the technical parameters on the options side — exceptionally low volatility and strong contango of gold’s forward curve — presented an incredibly cheap opportunity to protect the fund against any idiosyncratic risk in the yellow metal.
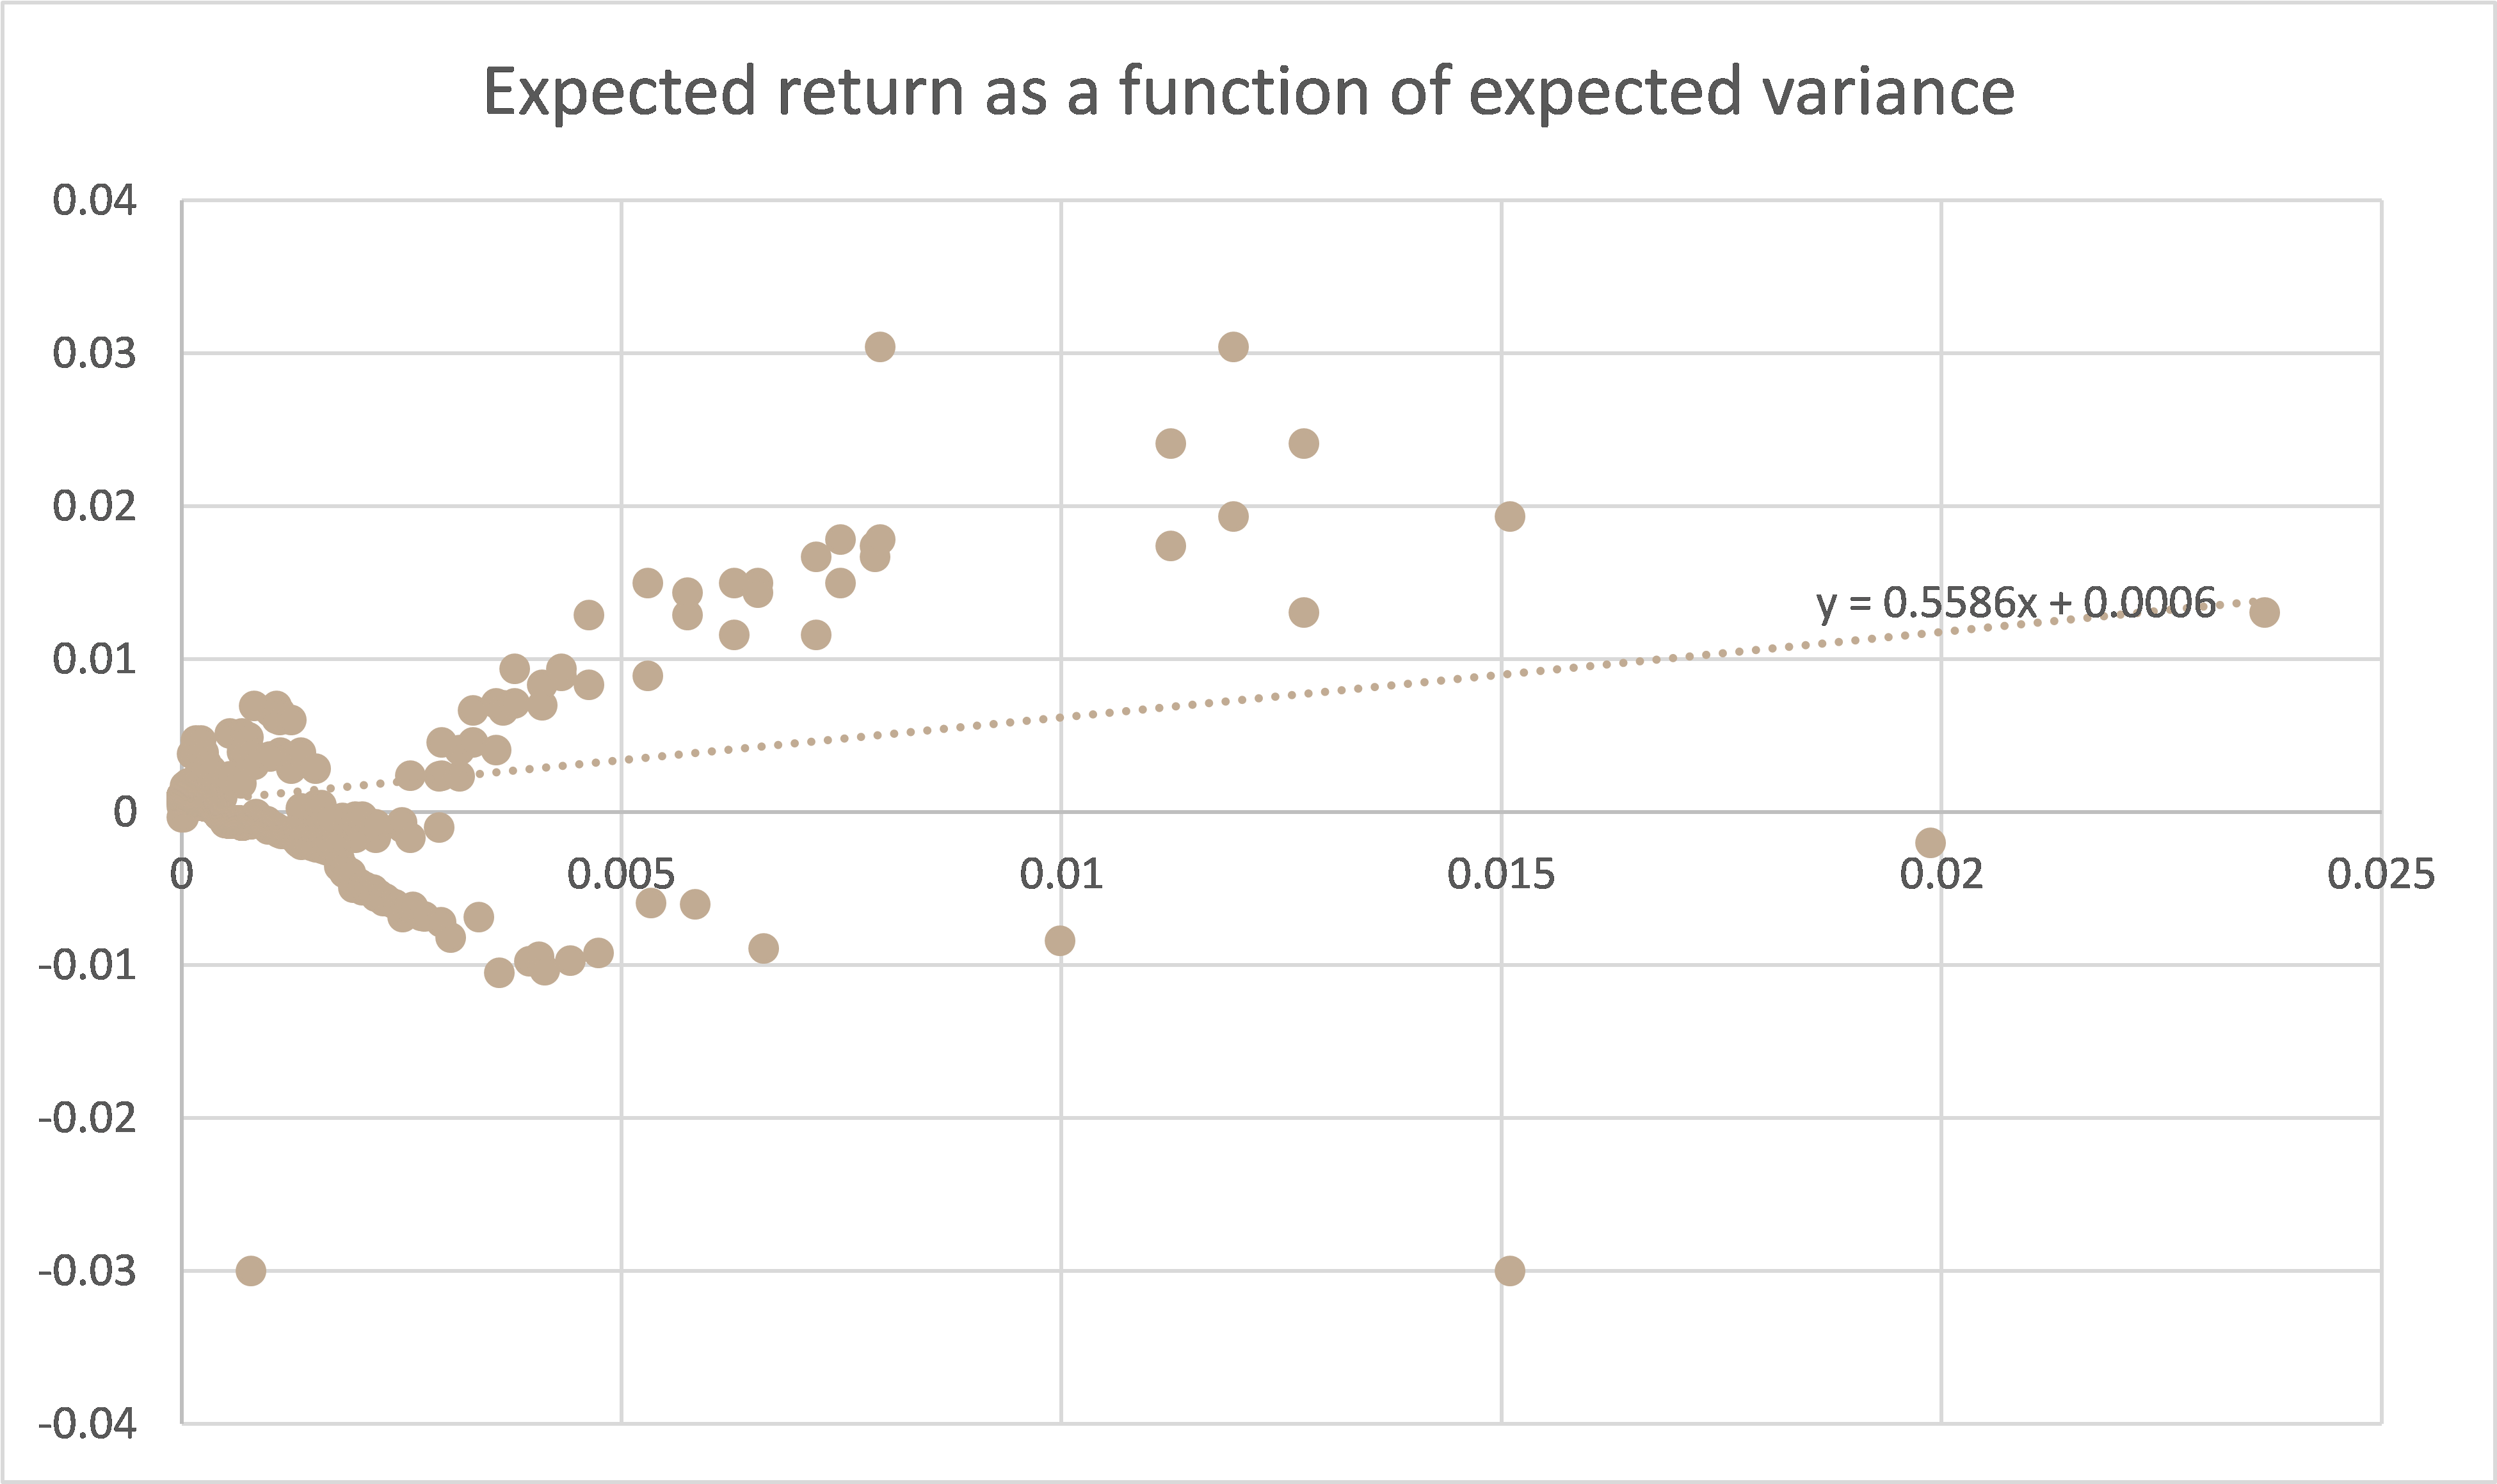
NCM Enhanced Physical Gold Macro Fund’s antifragile statistics:
Looking Forward
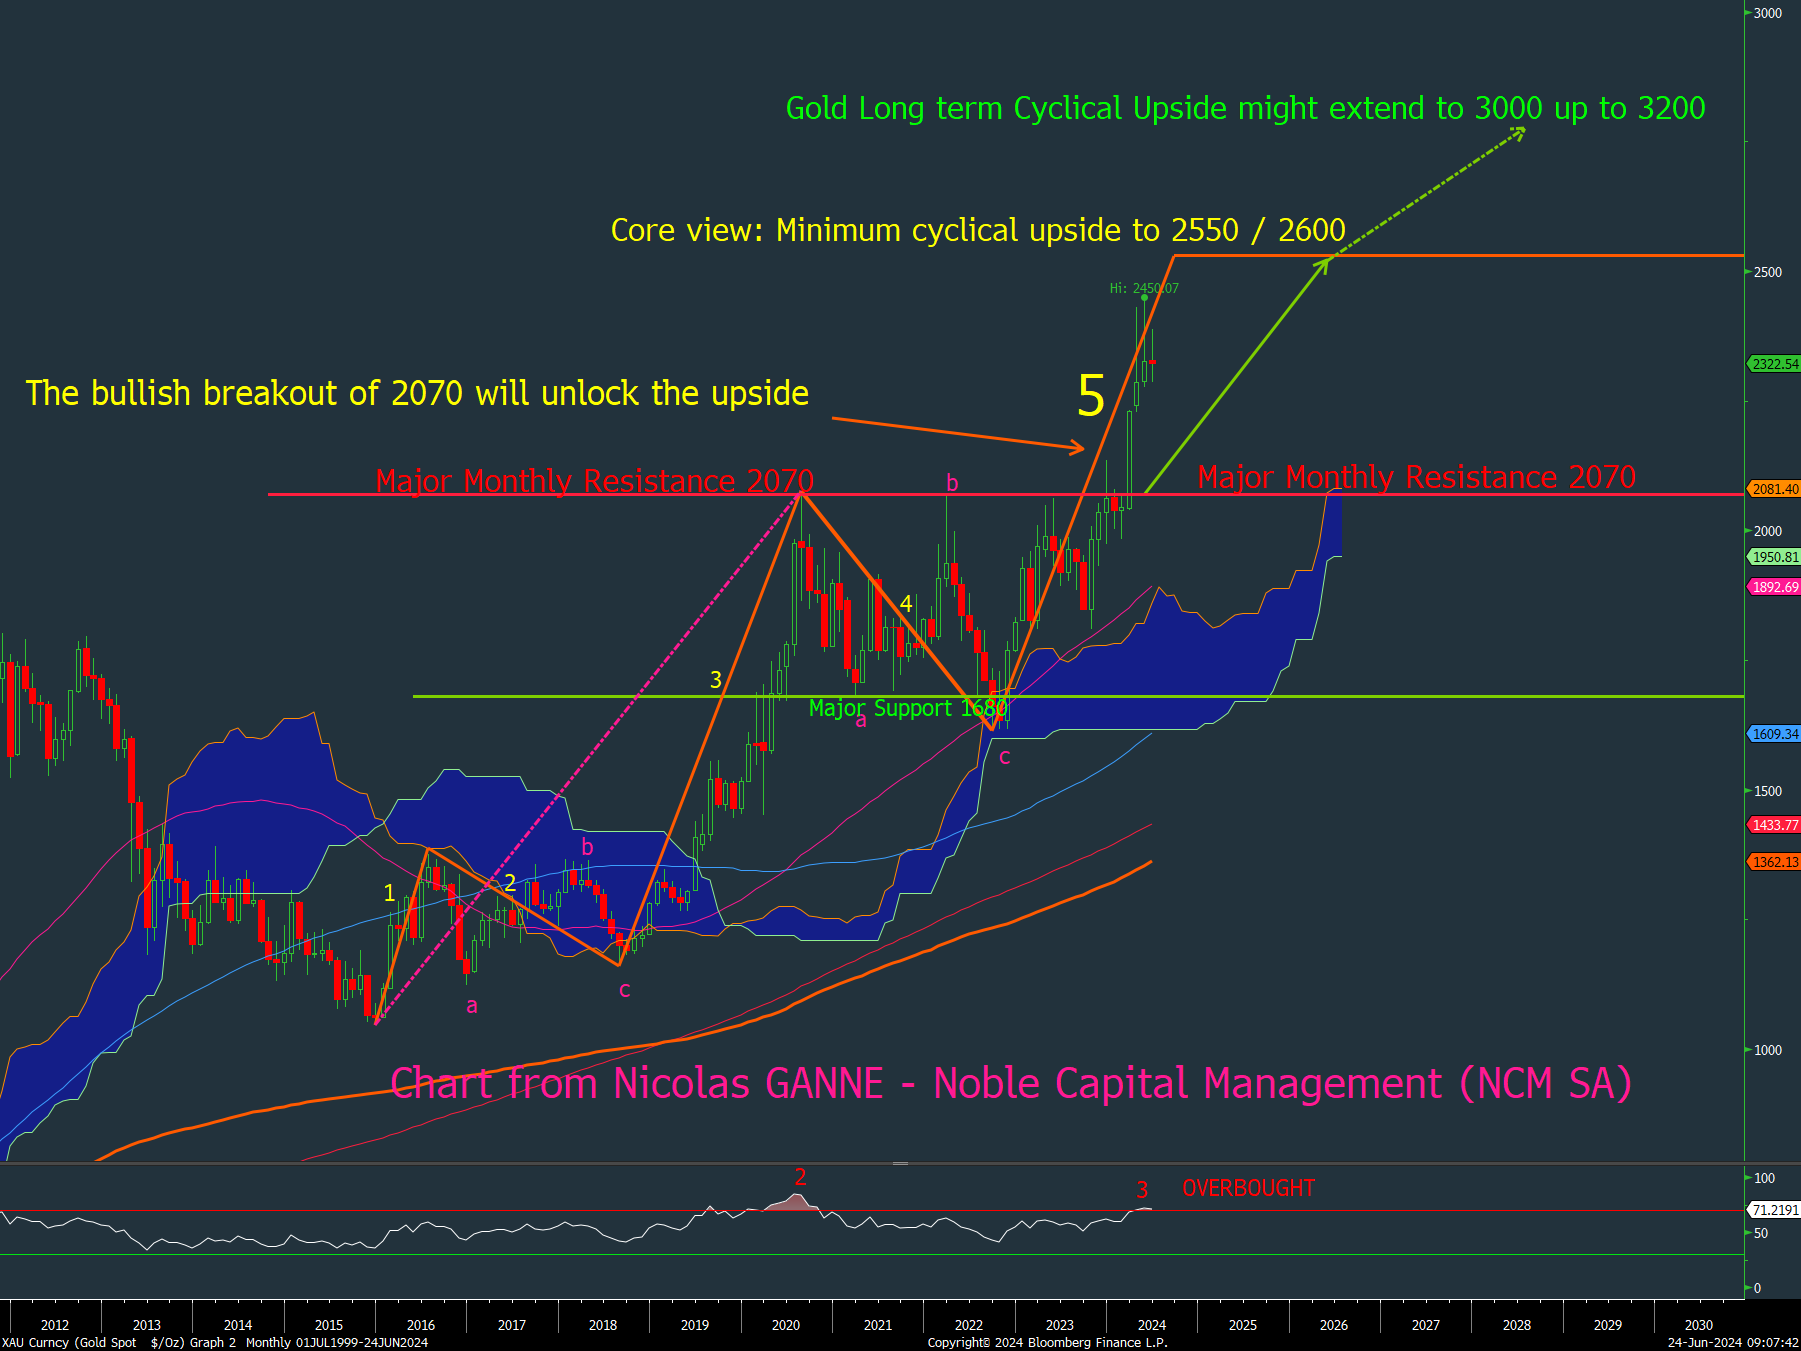
Considering the historically weak seasonality of precious metals and from a technical perspective (see chart overleaf), gold has entered a lateral trading range ($2,280 – $2,430) that could persist through the summer. We are taking advantage of this specific configuration by actively trading the corridor, allowing us to generate alpha during this trendless phase.
In such a context, Q3 could be a relatively quiet quarter, at least for gold. However, our long-term outlook remains extremely positive for gold and precious metals in general.
We reiterate our minimum upside target for gold at $2,600 XAU/USD in the medium term. In the longer term, its cyclical upside might likely extend much higher, towards the $3,000 to $3,200 targets within the next 12 to 18 months.
XAUUSD Monthly chart – Gold’s minimum long-term cyclical upside target at $3,000
We would like to thank our long-lasting research partners, GaveKal Research, Vincent Deluard, CFA StoneX and Ned Davis Research for their highly valuable contributions.
Hans Ulriksen, CEO and Fund Manager Christopher Boudin de l’Arche, Fund Manager
Legal information
This document is intended for information and/or marketing purposes only. It is not intended for distribution to, or use by, any person or entity who is a citizen or resident of any locality, state, country or jurisdiction where such distribution, publication, availability or use would be contrary to law or regulation. This document is not an offering memorandum and should not be considered a solicitation to purchase or invest in Noble Capital Management (NCM SA.
Disclaimer
NCM Enhanced Physical Gold Macro is a sub-fund of “NCM Alternative Assets, fonds à risque particulier” which is a contractual umbrella fund under Swiss law in the “other funds for alternative investments” category with specific risks. The sub-fund uses investment techniques whose risks cannot be compared with those of funds with traditional investments; in particular, the sub-funds may have significant leverage. Investors must be prepared to bear potential capital losses, which may be substantial or total. However, the fund management company and the asset manager endeavour to minimize these risks. In addition to market and currency risks, investors should be aware of risks relating to management, the negotiability of units, the liquidity of investments, the impact of redemptions, unit prices, service providers, lack of transparency and legal matters. These risks are detailed on pages 24 et 25 of the contractual fund.
Past performance is not a guide to future performance. Do remember that the value of an investment and the income generated from them can fall as well as rise and is not guaranteed, therefore, you may not get back the amount originally invested and potentially risk total loss of capital.
For a comprehensive list of risks involved in investing in the NCM Enhanced Physical Gold Macro Fund, please refer to the Appendix of the Fund Contract. If you have any doubts about the suitability of an investment, please consult a financial adviser.
The information and opinions contained herein are provided for information and advertising purposes only. It does not constitute a financial service or an offer under the Swiss Federal Law on Financial Services (FinSA). In particular, this document is neither an advice on investment nor a recommendation or offer or invitation to make an offer with respect to the purchase or sale of the sub-fund and shall not be construed as such. Further, this document shall not be construed as legal, tax, regulatory, accounting or other advice.
The terms and conditions, the risk information and other details on the sub-fund are contained in the fund documentation, in particular the Fund Contract and its Appendix. The Fund Contract and the Appendix of the NCM Enhanced Physical Gold Macro Fund as well as the annual reports and any other product documentation may be obtained on request and free of charge from Noble Capital Management (NCM) SA or the fund management company.
This document has been prepared based on sources of information considered to be reliable and accurate. However, the information contained herein is subject to change without notice and this document may not contain all material information regarding the financial instruments concerned. No representation or warranty is made as to the fairness, accuracy, completeness or correctness of the information contained herein. Noble Capital Management (NCM) SA is under no obligation to update, revise or affirm this document following subsequent developments.
0 Comments