Quarterly investors letter – Q1 2024
Market review
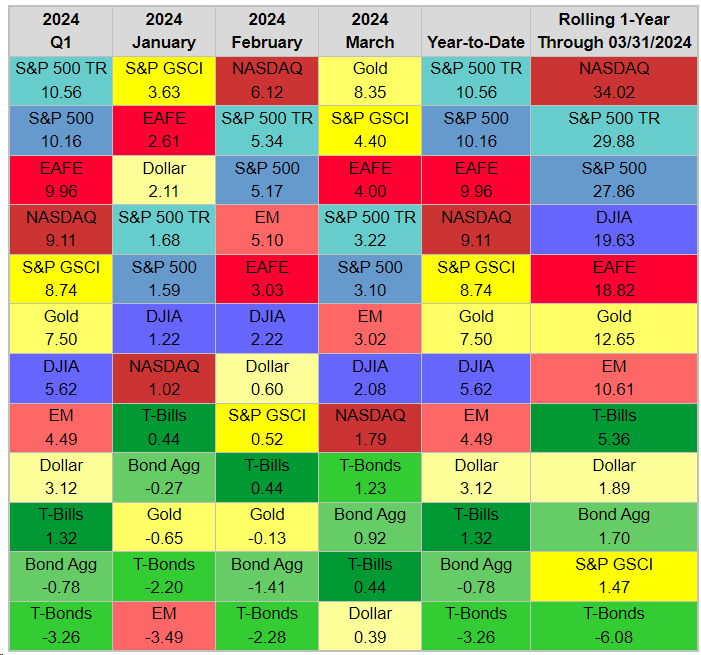
The strong momentum from the last two months of 2023 carried into 2024. The S&P 500 rose 10.2% in Q1, the best start to the year since 2019 and the 14th-best since 1926. Gains were broad-based, with all seven major MSCI country/region indices, all nine Russell style boxes, and 10 out of 11 S&P 500 sectors ending the quarter ahead of where they started. Unlike late-2023, stocks did not get any help from bonds. The Bloomberg U.S. Aggregate Index slipped 0.8% in the first three months of 2024. Sticky inflation, strong economic growth, and the repricing of when and how many times the Fed is going to cut short-term interest rates soured investors on bonds. The S&P 500 beat the Bloomberg Agg by 11.3% on a total return basis, the most in Q1 since 2012. History’s message for the rest of 2024 is positive for stocks on an absolute basis and relative to bonds, albeit at a slower rate than Q1’s torrid pace. When the S&P 500 has climbed at least 10% in Q1, it has added a median of 7.6% over the final nine months of the year. The big exceptions were 1987 and 1930.

Stocks over bonds. All equity indices in the table posted gains in Q1, led by the S&P 500’s 10.7% total return. The only two to decline were bond benchmarks, led by long-term Treasury bonds’ -3.3%. The Bloomberg U.S. Aggregate Index fell 0.8%. T-bills matched their best return since Q4 2000 at 1.3%, but that was still the third-worst in the table.
S&P 500 over Nasdaq & DJIA. Often the Nasdaq tracks the relative strength of Growth stocks and the DJIA is a proxy for Value, with the S&P 500 in the middle. The fact that the S&P 500 outpaced both the Nasdaq and DJIA in Q1 speaks to the muddled Growth/ Value performance.
Commodity comeback. The S&P/GSCI rebounded from a terrible Q4 with an 8.7% gain in Q1. The GSCI is production-weighted, so crude oil’s 13.1% gain boosted the index. However, commodity gains were broad-based, with the equal-weighted CRB Index climbing 10.0%.
Broken (golden) record. Gold ended the quarter at a record high, adding another 7.5% to its previous all-time high set in December. Investors can debate whether gold remains an alternative currency, but no one can question its recent price action.
Dollar strength. Often commodities and the U.S. dollar are inversely correlated, but stronger growth and higher rates boosted the attractiveness of the greenback despite the commodity rally. The U.S. Dollar Index added 3.1% in the first quarter.
Our take
Since March’s onset, gasoline prices in the US have climbed by 8.2%. At the same time, in the realm of finance, there’s been an 8%+ increase in gold prices, a 5.6% rise in copper, a 10-basis point uplift in 10-year US treasury yields, and a 0.4% ascent in the US dollar value, as indicated by the DXY index.
This blend of trends is atypical. Normally, a simultaneous uptick in yields and the dollar’s value causes commodities, especially gold, to perform poorly. However, an exception arises during periods of economic inflationary growth. Recent data suggests we are in such a phase. Notably, China’s PMI exceeded expectations, a sentiment echoed by the US ISM manufacturing PMI. A standout detail within the ISM data was a significant leap in the manufacturing prices index to a peak unseen in 21 months. This is part of a series of global data releases that have been consistently outperforming expectations, hinting at an emerging inflationary boom now starting to mirror in financial market trends. Energy stocks, after a period of consolidation, are on the brink of breaking out, surpassing technology stocks in year-to-date performance. Conversely, long-dated US treasuries are performing poorly, with T-Bonds down by 3.26% year-to-date.
In essence, economic indicators are signalling an inflationary boom, supported by aggressive fiscal policies in the US and China. Key commodities are reaching new highs or breaking past recent ranges, equity markets are diversifying with cyclical sectors leading the charge, and government bonds are on the decline. It is becoming increasingly clear that we are in the midst of an inflationary boom, yet many investors remain unprepared, still favouring US growth stocks over global value stocks; recessionary hedges versus inflationary strategies.
Given current portfolios positioning around the globe, the inflationary rebalancing of asset allocators that is starting will have many more legs. The yellow metal has broken to the upside its triple top level of 2’070 $/Oz, recording a +7.5% performance YTD at almost 2’230 $/Oz. Driven by record buying from Eastern Central Banks in a context of de-dollarisation, persistent geopolitical tensions and upcoming cycle of monetary easing, despite inflation in the U.S. remaining well above the Fed’s 2% target.
This takes us to our other strong belief underpinning NCM Enhanced Physical Gold Macro Fund: the 2% inflation target is dead.
The financial community might have misinterpreted the US central bank’s signals. One possibility is that excessive emphasis was placed on the median 2024 projection, which seemed to signal three rate cuts. Notably, a minimum of five Federal Open Market Committee (FOMC) members revised their short-term interest rate forecasts upwards, and the committee adjusted its neutral rate projection upwards as well.
Nonetheless, Chairman Powell’s statement—suggesting that “financial conditions are impacting economic activity”—dispelled any confusion from the Economic Projections Summary, signalling to investors that the Fed was essentially giving a green light.
The scenario of inflation reverting to 2% appears highly improbable. Contrary to signs of economic deceleration, tax revenue surged by 6.1% last month. Factors like gasoline prices at $3.5 per gallon, a recovering housing market, and rising asset values are likely to fuel a secondary inflationary wave this summer.
As Vincent Deluard from StoneX turned it, “C. Doyle observed that “when you have eliminated the impossible, whatever remains, however improbable, must be the truth”. The only possible explanation for the Fed’s dovish pivot is that it gave up on the 2% inflation target. Which is consistent with the reality that inflation has already run above the Fed’s target for 36 straight months”. Moreover, the FOMC has revised its growth and inflation forecasts upwards. The March Economic Projections seem influenced by the “Dark Side of the Moon” report, suggesting the Fed is bracing investors for an economic overhaul characterized by heightened growth, interest rates, deficits, and inflation.
This hawkish interpretation conflicts with Powell’s denial of the risk posed by loosening financial conditions. In his press conference, Powell equated financial conditions with the Taylor Rule, claiming they were dampening economic activity. Powell is well aware that financial conditions encompass credit spreads, market sentiment, and asset prices—terms he accurately used in describing policy tightening effects after a selloff in November.
While the Economic Projections Summary might have been vague, Powell’s remarks at the press conference were intentionally dovish.
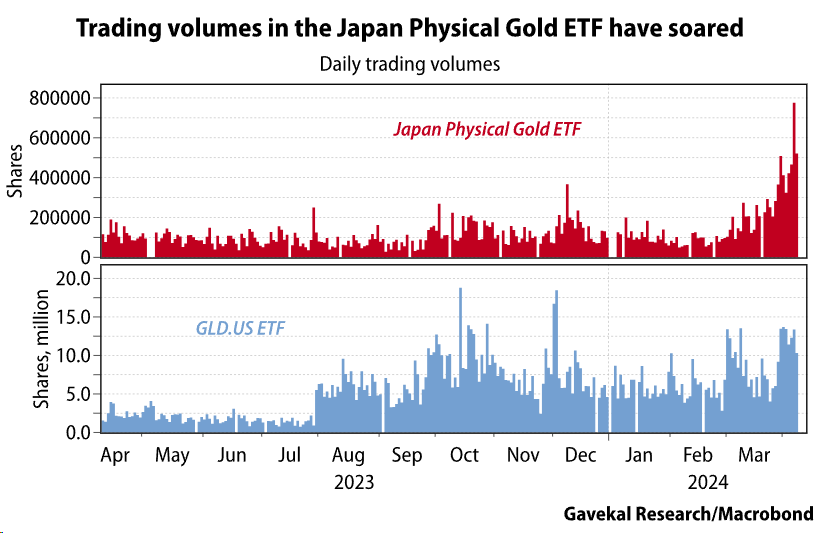
So, what is next for precious metals prices? In order to answer this fundamental question, we need first to understand what have been the triggers of this recent rally and who might be the next marginal buyers. It is now well known that Eastern central banks are steady buyers of physical gold but, as Louis-Vincent Gave at GaveKal correctly pointed it out, and strengthening the case of a rally fuelled from the East, are the trading volumes in the Japan Physical Gold ETF (1540.JT) going bananas right after the BOJ meeting, while volumes in the Western known ETF (GLD US) have remained immune from the recent gold price surge.

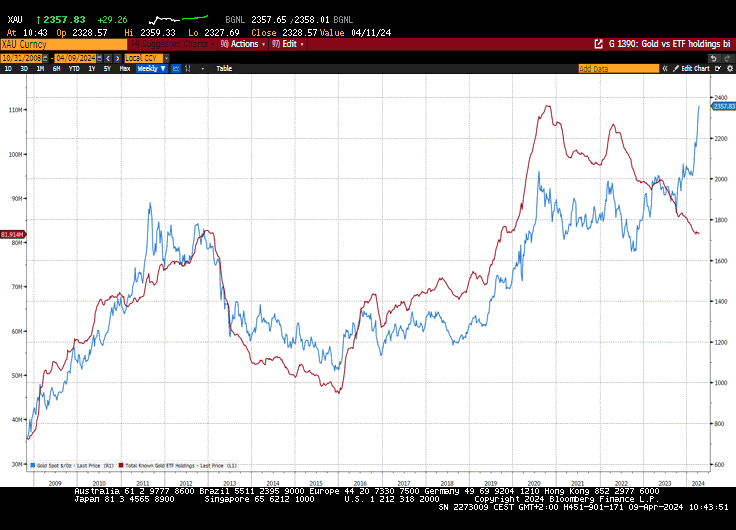
Given the BOJ’s promise to Japanese savers to make them lose 2% to 3% in real terms on their savings, it is no surprise that those same savers start to pile up on Gold. Pretty much to the same conclusion (but for other reasons) arrived the Chinese savers. Given the lack of credible alternatives on the local markets, Chinese Investors are also accumulating Gold. Eastern world investors are momentum-driven, implying they could push the nascent trend in precious metals a lot further. Furthermore, considering the discrepancy of Western investor’s participation (see Chart below Gold (blue) vs ETF Total Assets (red)) probably distracted by the crypto-frenzy, these represent a reservoir of additional marginal buyers to come.

NCM Enhanced Physical Gold Macro Fund Review
This first quarter of the year has seen the Fund performing strongly thanks to March’s major advance (+16.91%, second best month ever after Nov22) marking the YTD performance at +11.36% for the USD share class (+19.28% in March and +18.85% YTD for the CHF share class).

We are particularly satisfied by the Q1 result, since it underscores, again, the portfolio convexity allowing us to outperform handsomely Gold BM on the up moves (558bp over BM in March). This is the result of our disciplined management of gross exposures, increasing them in corrective phases while reducing them in uptrends. Adding to that, the satellite allocations to peripheral precious metals, as expected, are starting to pay out, particularly on Silver being the best performer metal YTD. Currency trading has contributed positively as well, mainly led by the Swiss Franc weakness, which we implemented, via a OneTouch option and directional short positions. We retain a sizeable position in short USDJPY as a hedge for a more hawkish BOJ that could derail one of the drivers behind Gold’s positive trend (see rationale above in Our take). Last but not least, we did implement a hedge on the rise of 10Yr UST yields, given our inflationary bias. It turned out that the trade has been a win-win situation given Gold and yields have been rising simultaneously.
Looking Forward
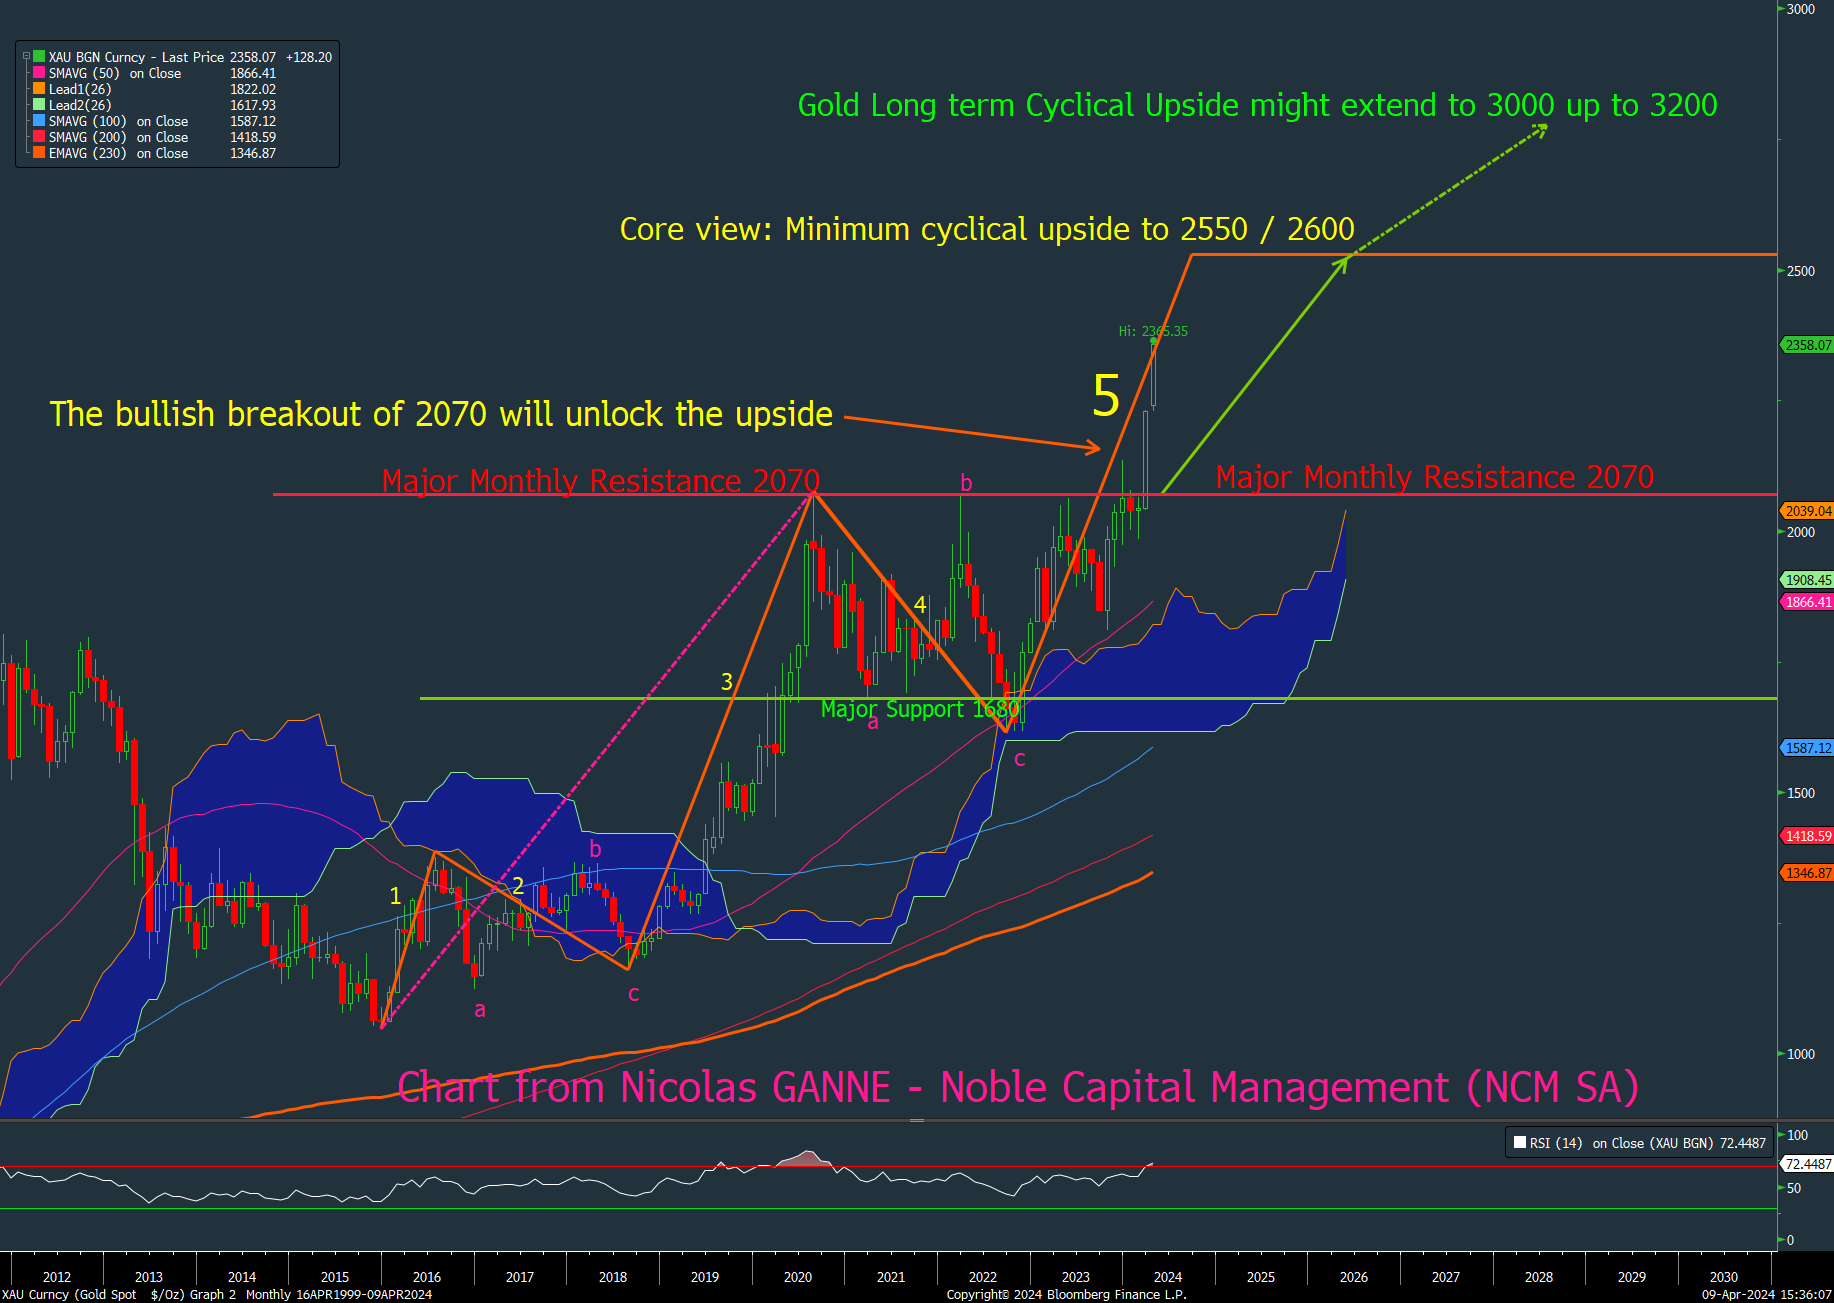
From a purely technical perspective (see chart overleaf), the Gold bullish breakout of the 2070 major resistance witnessed in early March 2024 is a crucial technical & cyclical bullish event.
That well-identified distribution area was the former cyclical top of 2020/2022/2023. The recent bullish breakout is validating the current impulse wave 5 underway (was previously conditional to the break of 2070) and hence the likeliness to make new cyclical highs in the next 2 years. This is also drastically positively shifting market sentiment towards Gold which is another supportive factor for its expected primary bullish trend.
This crucial breakout further reinforces our core view that Gold’s minimum cyclical upside is the 2600 XAU/USD target for the medium term.
We believe Gold’s long-term cyclical upside might most likely extend much higher, towards the 3000 up to the 3200 targets in the next 12 to 18 months.

XAUUSD Monthly chart – The bullish breakout of the 2070 cyclical § the upside
We would like to thank our long-lasting research partners, GaveKal Research, Vincent Deluard, CFA StoneX and Ned Davis Research for their highly valuable contributions.
Sincerely yours,
Hans Ulriksen, CEO and Fund Manager Christopher Boudin de l’Arche, Fund Manager
Legal information
This document is intended for information and/or marketing purposes only. It is not intended for distribution to, or use by, any person or entity who is a citizen or resident of any locality, state, country or jurisdiction where such distribution, publication, availability or use would be contrary to law or regulation. This document is not an offering memorandum and should not be considered a solicitation to purchase or invest in Noble Capital Management (NCM SA.
Disclaimer
NCM Enhanced Physical Gold Macro is a sub-fund of “NCM Alternative Assets, fonds à risque particulier” which is a contractual umbrella fund under Swiss law in the “other funds for alternative investments” category with specific risks. The sub-fund uses investment techniques whose risks cannot be compared with those of funds with traditional investments; in particular, the sub-funds may have significant leverage. Investors must be prepared to bear potential capital losses, which may be substantial or total. However, the fund management company and the asset manager endeavour to minimize these risks. In addition to market and currency risks, investors should be aware of risks relating to management, the negotiability of units, the liquidity of investments, the impact of redemptions, unit prices, service providers, lack of transparency and legal matters. These risks are detailed on pages 24 et 25 of the contractual fund.
Past performance is not a guide to future performance. Do remember that the value of an investment and the income generated from them can fall as well as rise and is not guaranteed, therefore, you may not get back the amount originally invested and potentially risk total loss of capital.
For a comprehensive list of risks involved in investing in the NCM Enhanced Physical Gold Macro Fund, please refer to the Appendix of the Fund Contract. If you have any doubts about the suitability of an investment, please consult a financial adviser.
The information and opinions contained herein are provided for information and advertising purposes only. It does not constitute a financial service or an offer under the Swiss Federal Law on Financial Services (FinSA). In particular, this document is neither an advice on investment nor a recommendation or offer or invitation to make an offer with respect to the purchase or sale of the sub-fund and shall not be construed as such. Further, this document shall not be construed as legal, tax, regulatory, accounting or other advice.
The terms and conditions, the risk information and other details on the sub-fund are contained in the fund documentation, in particular the Fund Contract and its Appendix. The Fund Contract and the Appendix of the NCM Enhanced Physical Gold Macro Fund as well as the annual reports and any other product documentation may be obtained on request and free of charge from Noble Capital Management (NCM) SA or the fund management company.
This document has been prepared based on sources of information considered to be reliable and accurate. However, the information contained herein is subject to change without notice and this document may not contain all material information regarding the financial instruments concerned. No representation or warranty is made as to the fairness, accuracy, completeness or correctness of the information contained herein. Noble Capital Management (NCM) SA is under no obligation to update, revise or affirm this document following subsequent developments.
0 Comments